ClassificationEnsembles-vignette
ClassificationEnsembles-vignette.RmdWelcome to ClassificationEnsembles! The goal of ClassificationEnsembles is to automatically conduct a thorough analysis of classification data. The user only needs to provide the data, answer a few questions, and the package does all the rest for you!.
ClassificationEnsembles automatically fits 15 individual models, to the training data, and also makes predictions and checks accuracy on the test and validation data sets.It also builds 10 ensembles of models, fits each ensembles model to the training ensemble data, makes predictions and checks accuracy on the test and validation data. The package automatically returns 11 plots, and four summary tables. The summary report shows the most accurate results at the top of the report.
The function will automatically work with any number of levels. In this example the data has three levels. Note that the function will automatically figure out the three levels, and build the models from there.
Installation
You can install the development version of ClassificationEnsembles like so:
devtools::install_github("InfiniteCuriosity/ClassificationEnsembles")Example
Classification(data = ISLR::Carseats,
colnum = 7,
numresamples = 2,
do_you_have_new_data = "N",
how_to_handle_strings = 1,
save_all_trained_models = "N",
use_parallel = "N",
train_amount = 0.60,
test_amount = 0.20,
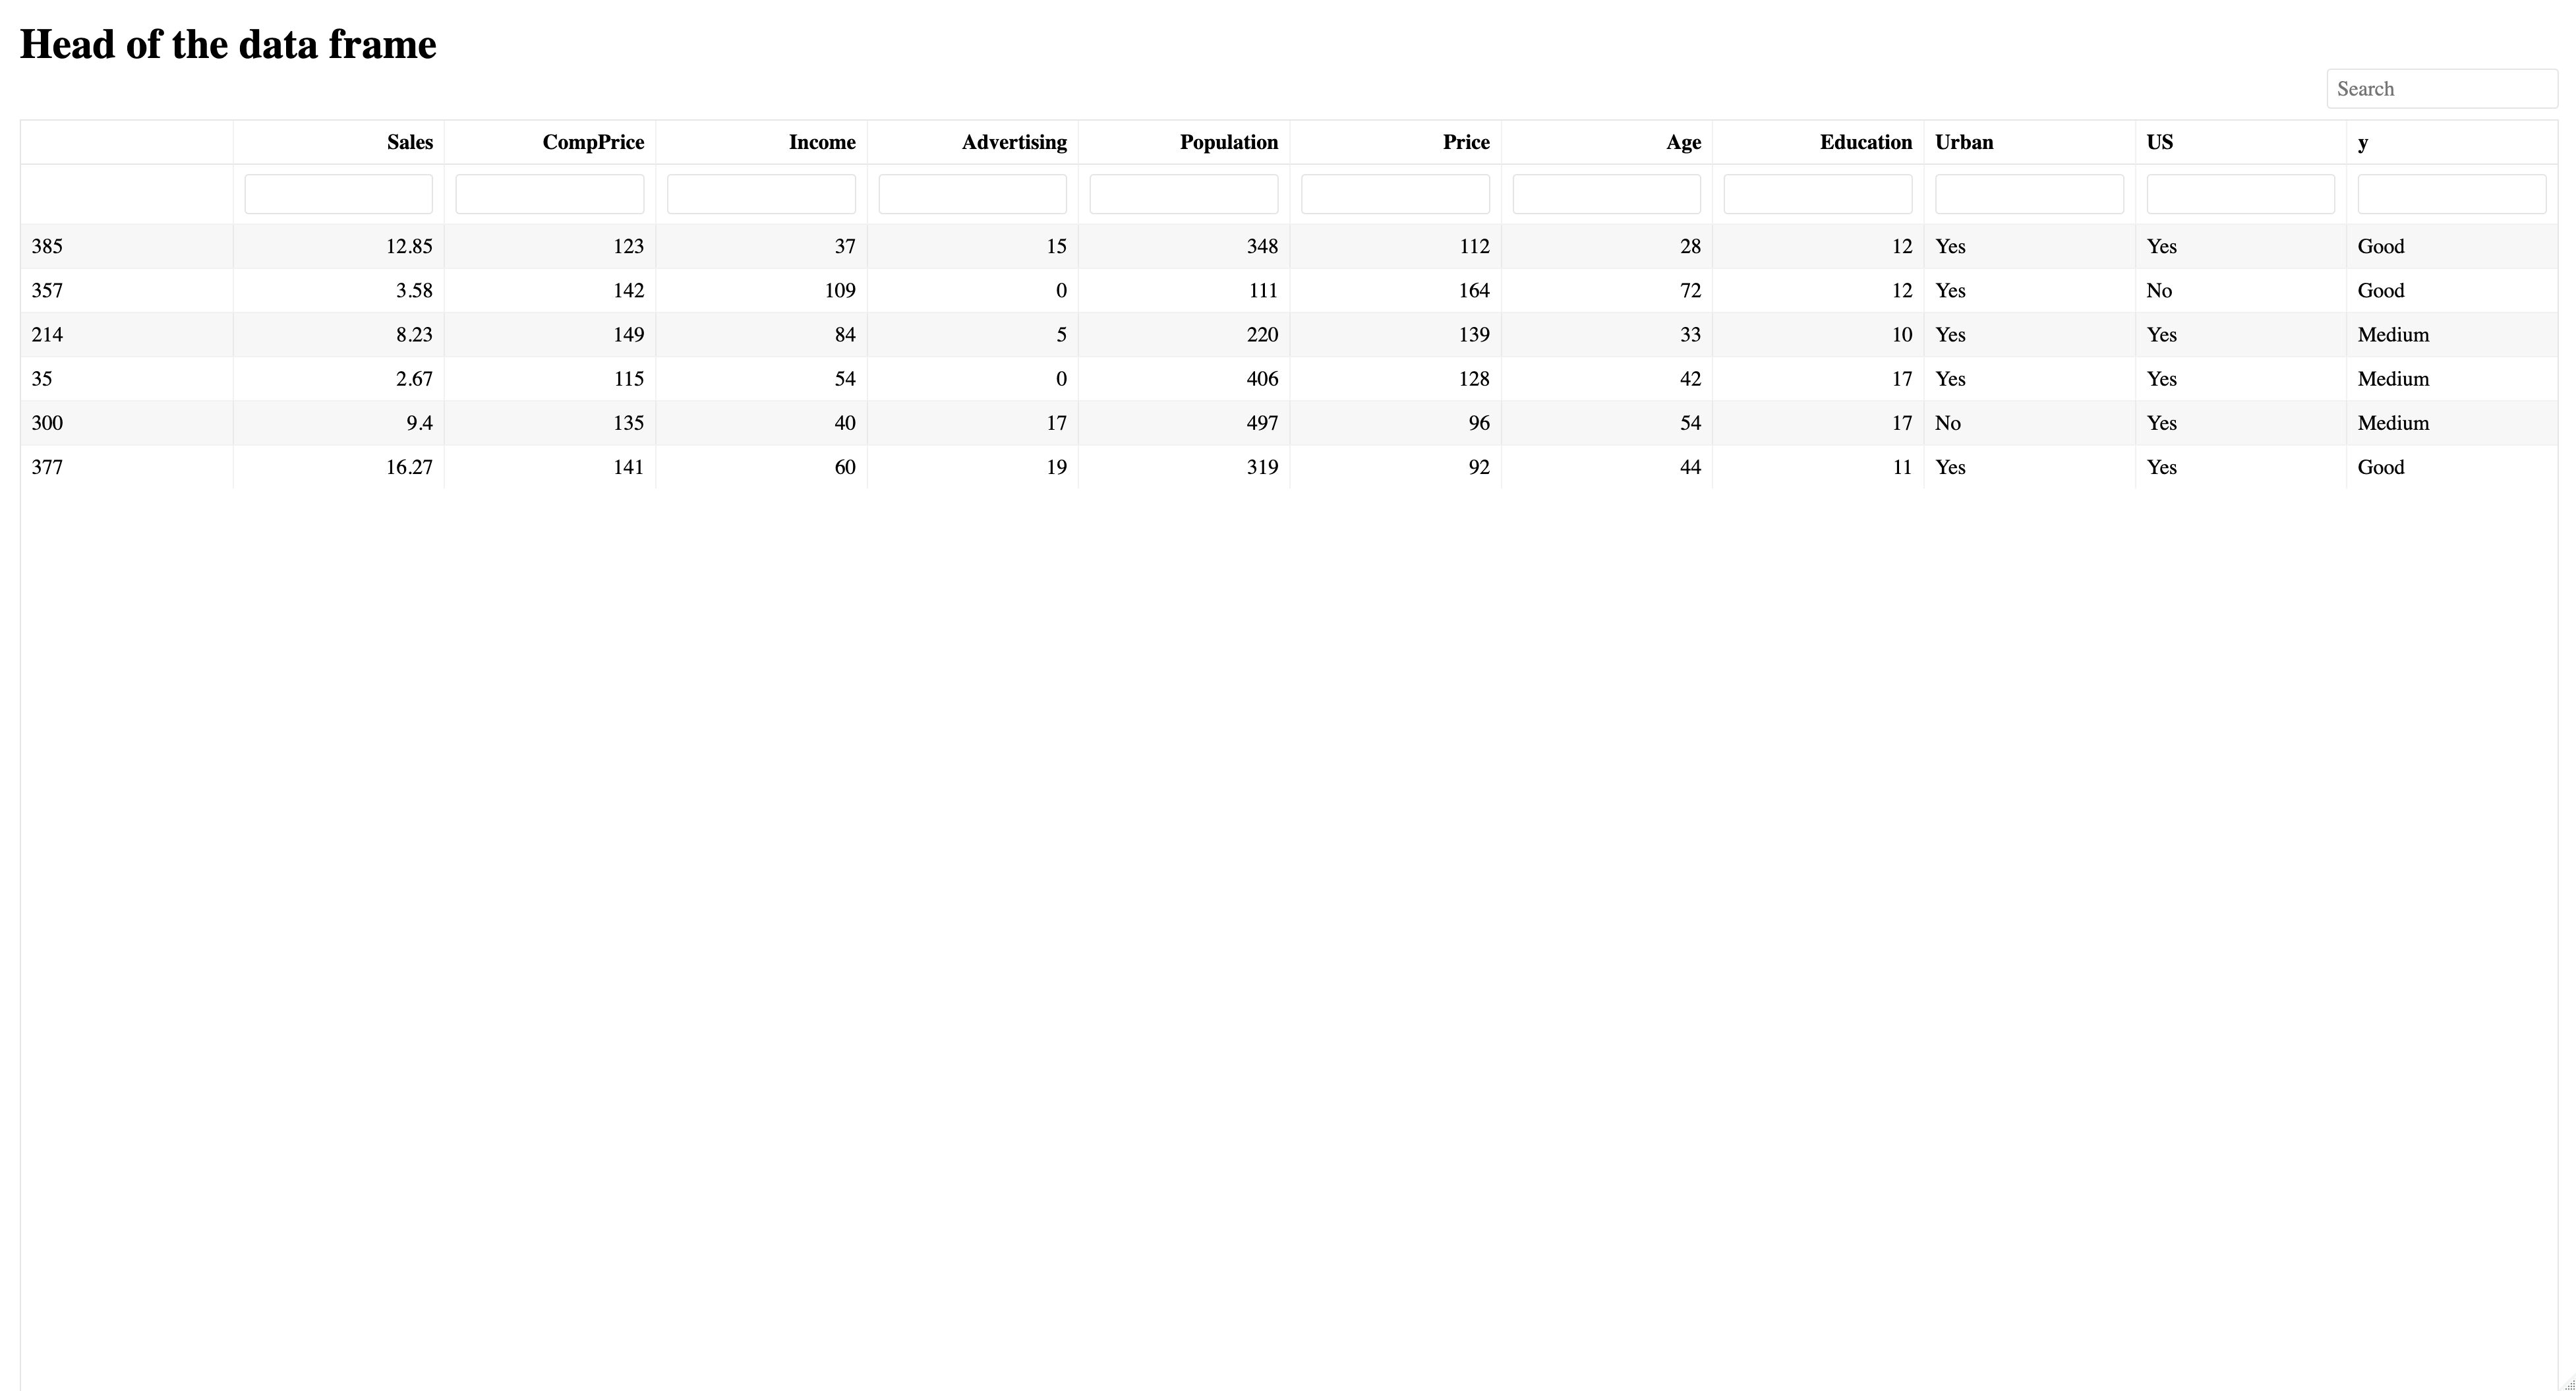
validation_amount = 0.20)ClassificationEnsembles will automatically build 25 models to predict the location of carseats (Bad, Medium, Good). The data is available as part of the ISLR package.
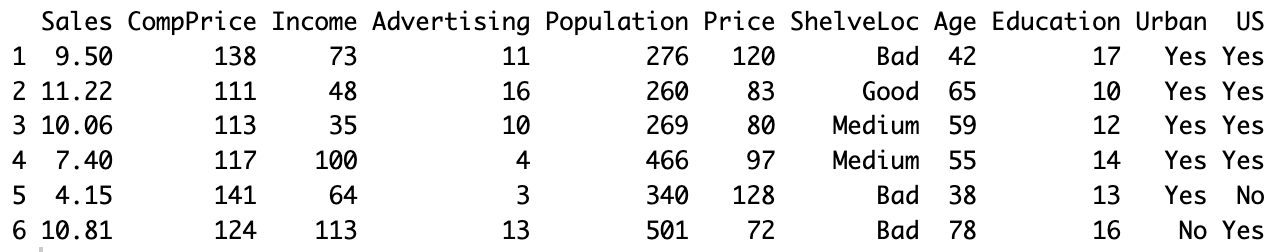
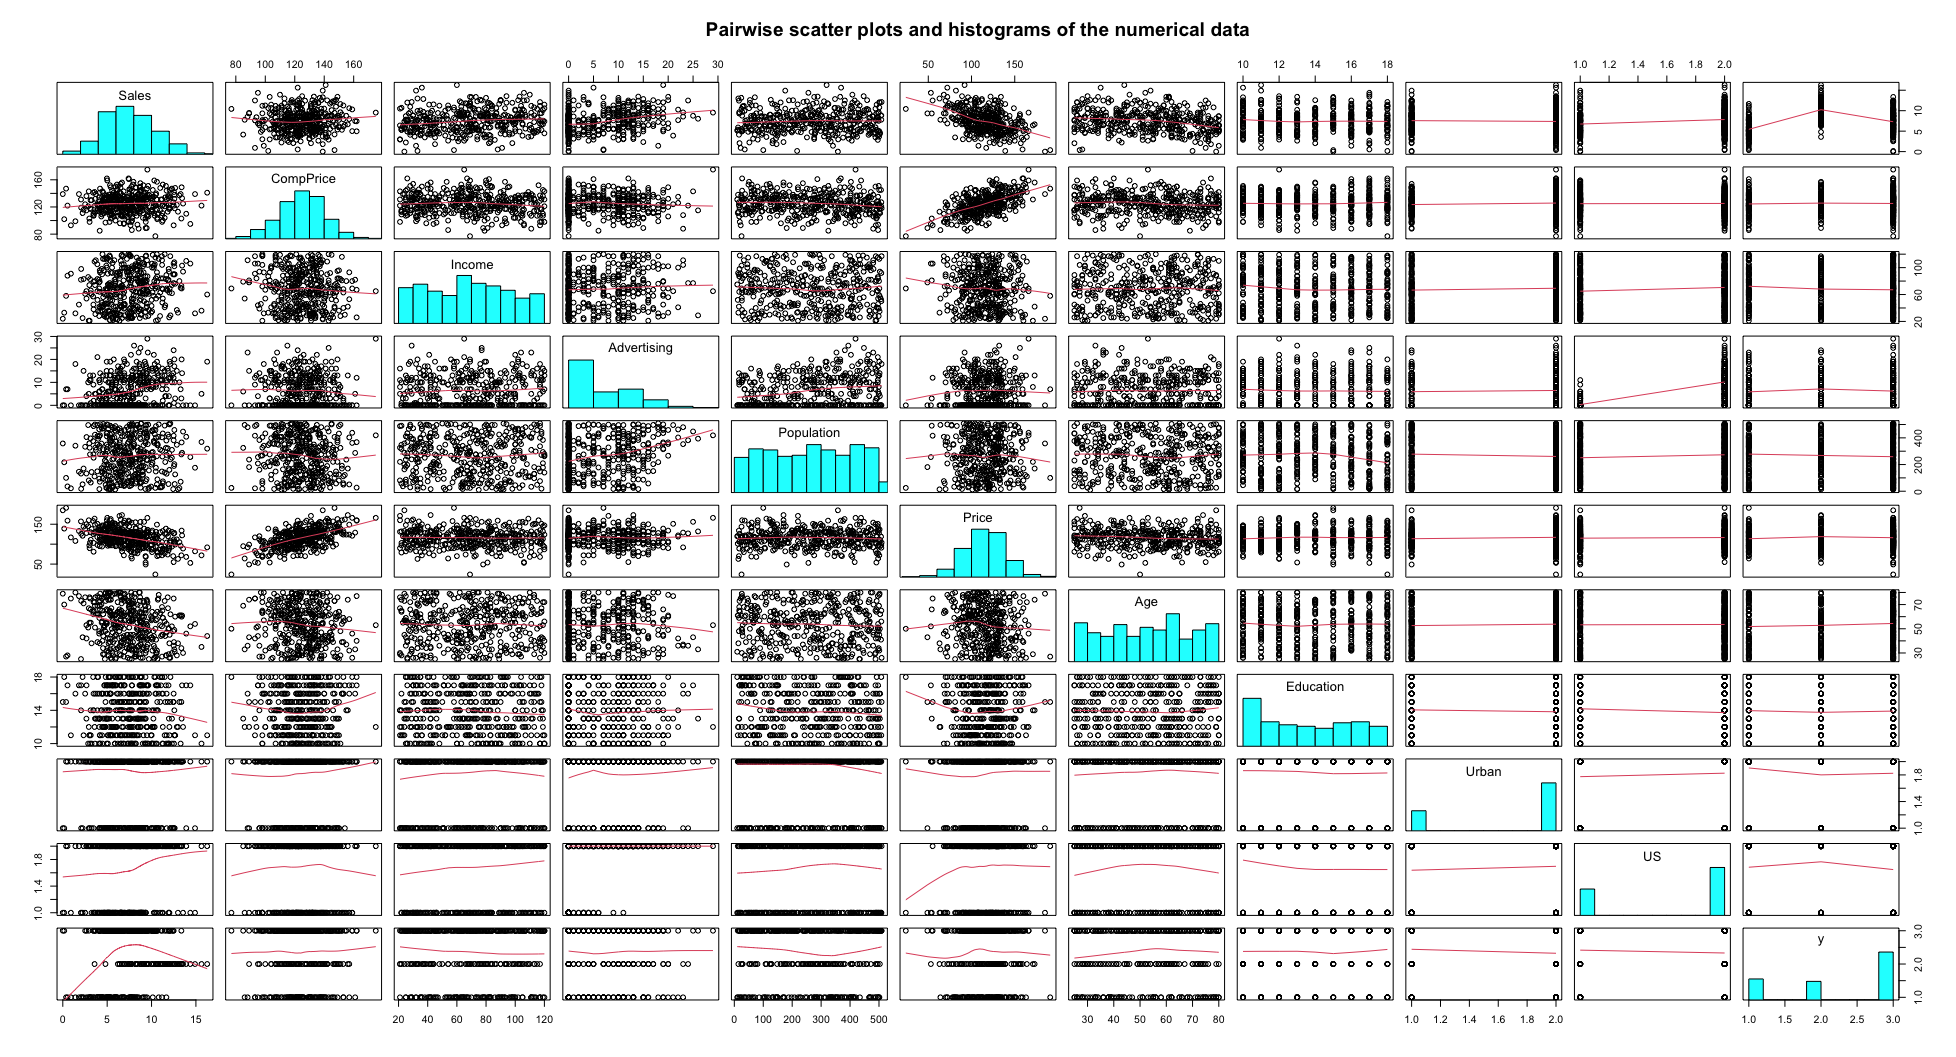
This is the head of the data set. We will be modeling the ShelveLoc column:
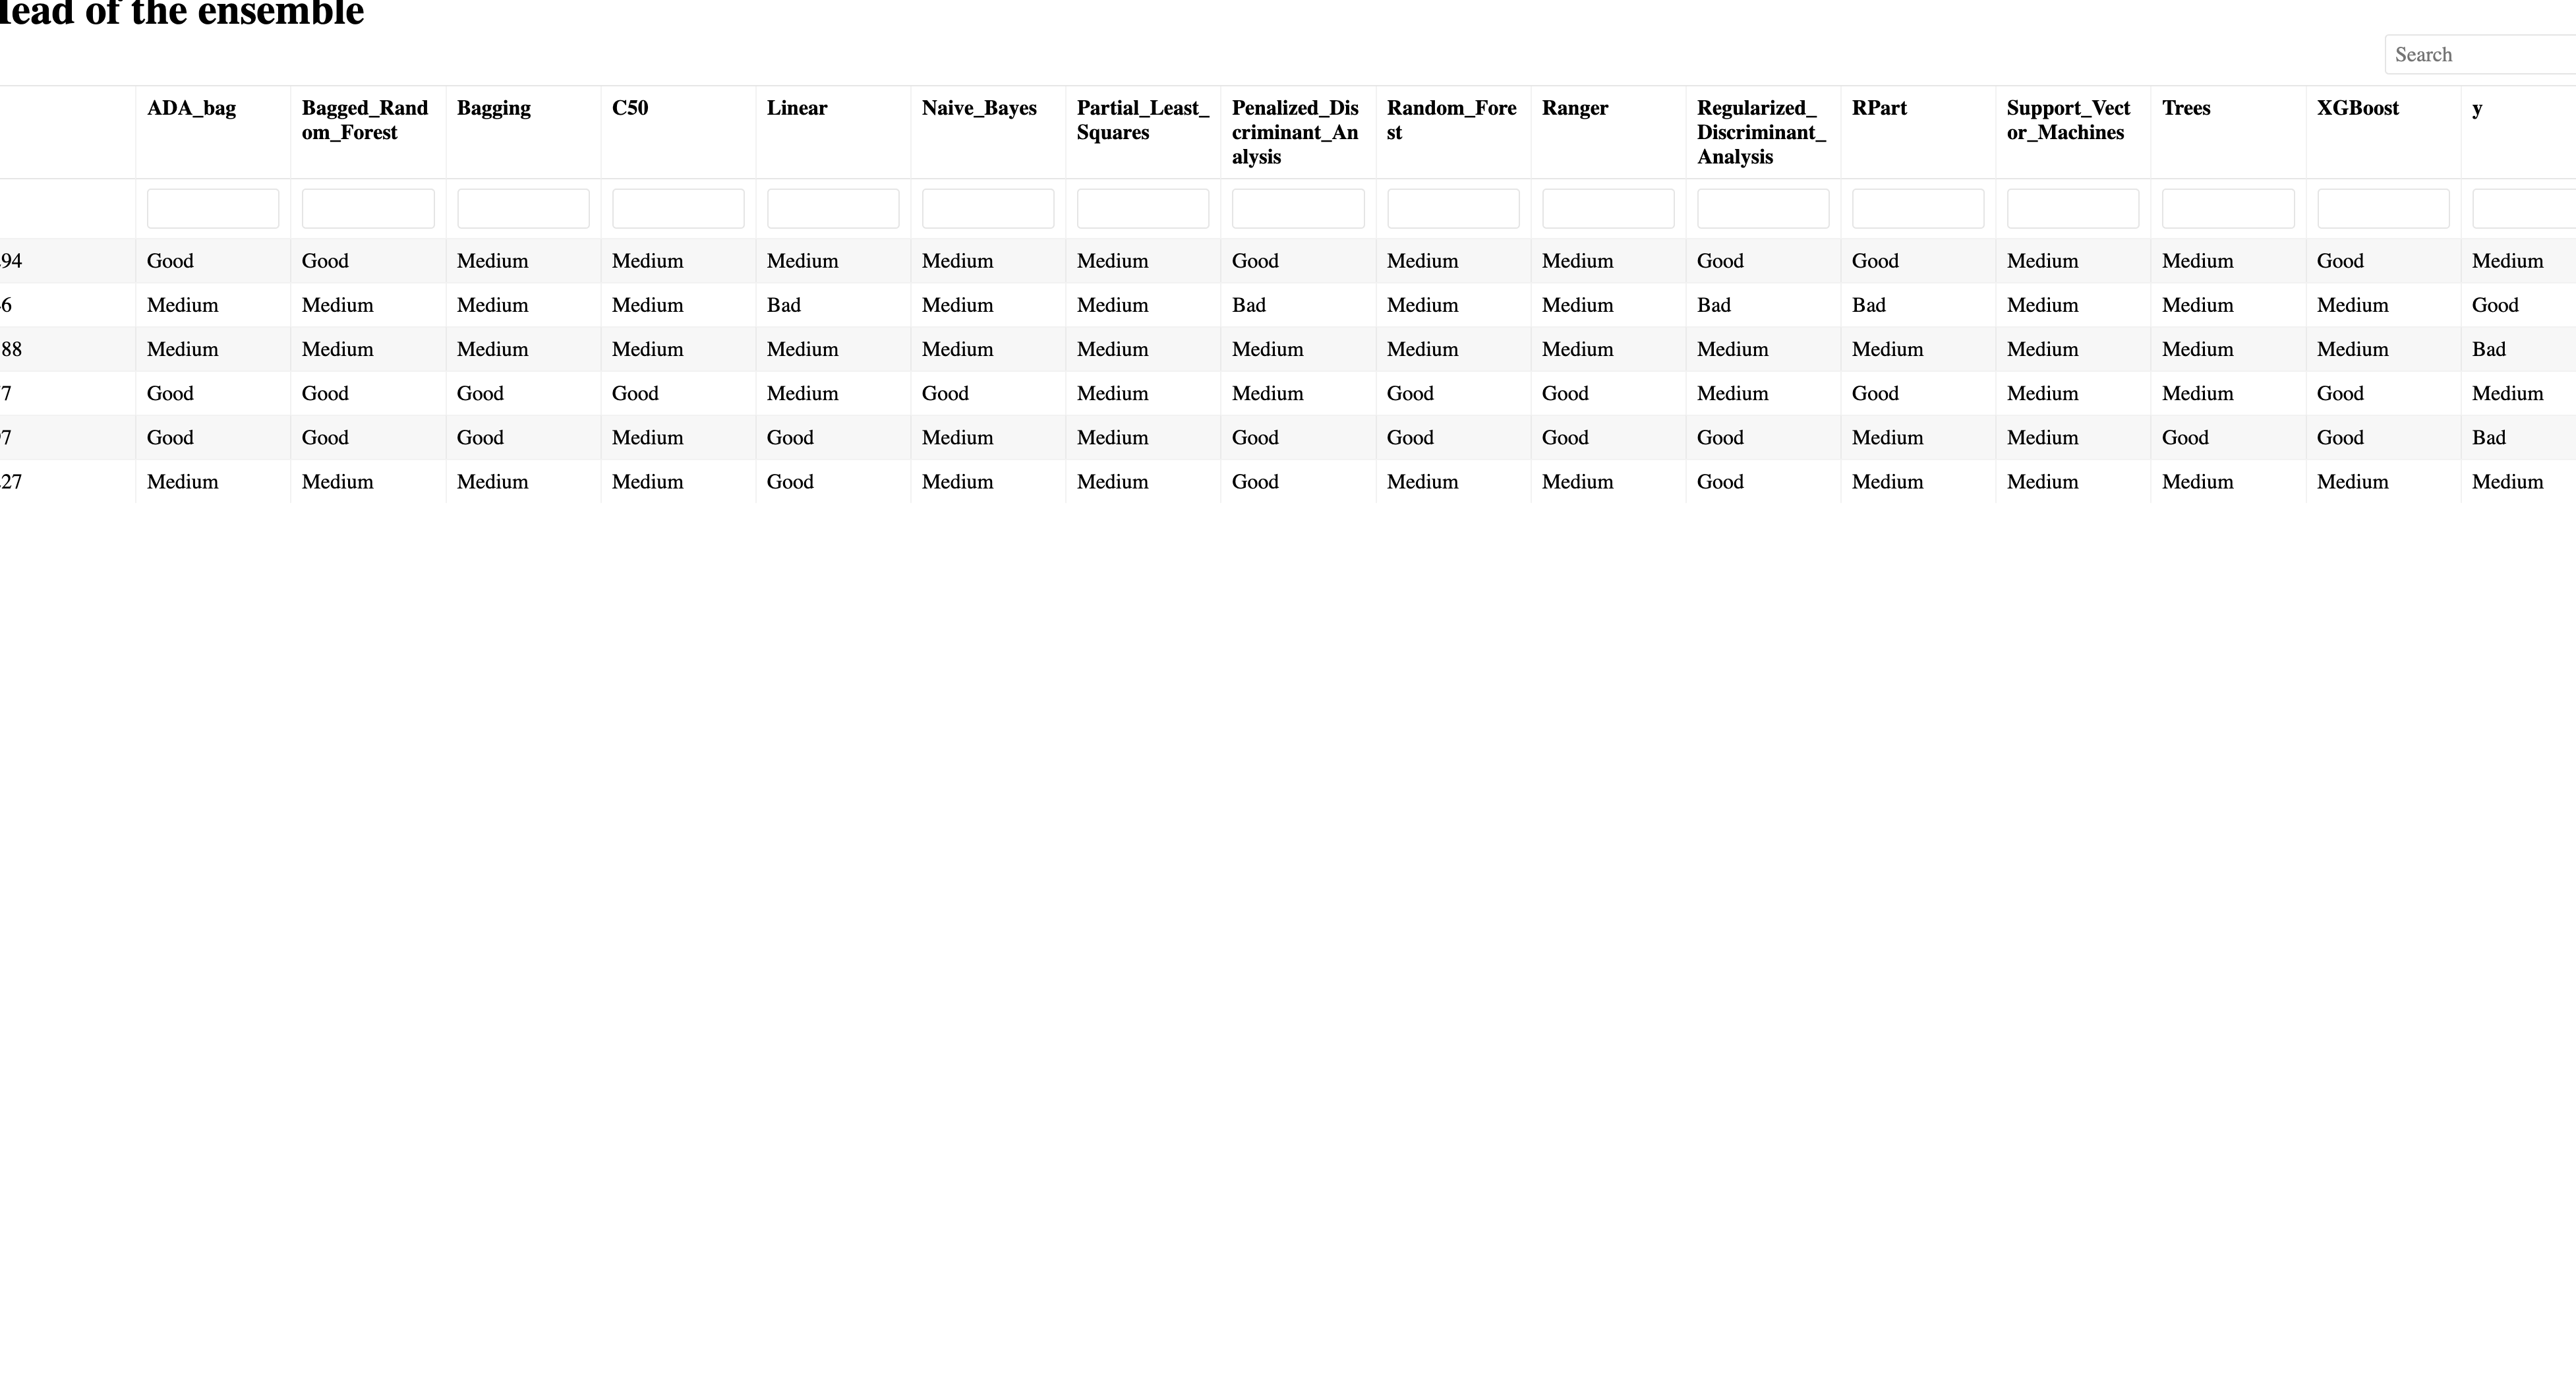
The 15 individual classification models are:
Adabag
Bagging
Bagged Random Forest
C50
Linear
Naive Bayes
Partial Least Squares
Penalized Discriminant Analysis
Random Forest
Ranger
Regularized Discriminant Analysis
RPart
Support Vector Machines
Trees
XGBoost
The 10 ensembles are:
Ensemble ADA Bag
Ensemble Bagged Cart
Ensemble Bagged Random Forest
Ensemble C50
Ensemble Naive Bayes
Ensemble Ranger
Ensemble Random Forest
Ensemble Regularized Discriminant Analysis
Ensemble Support Vector Machines
The 11 plots automatically created (these are close-up views)
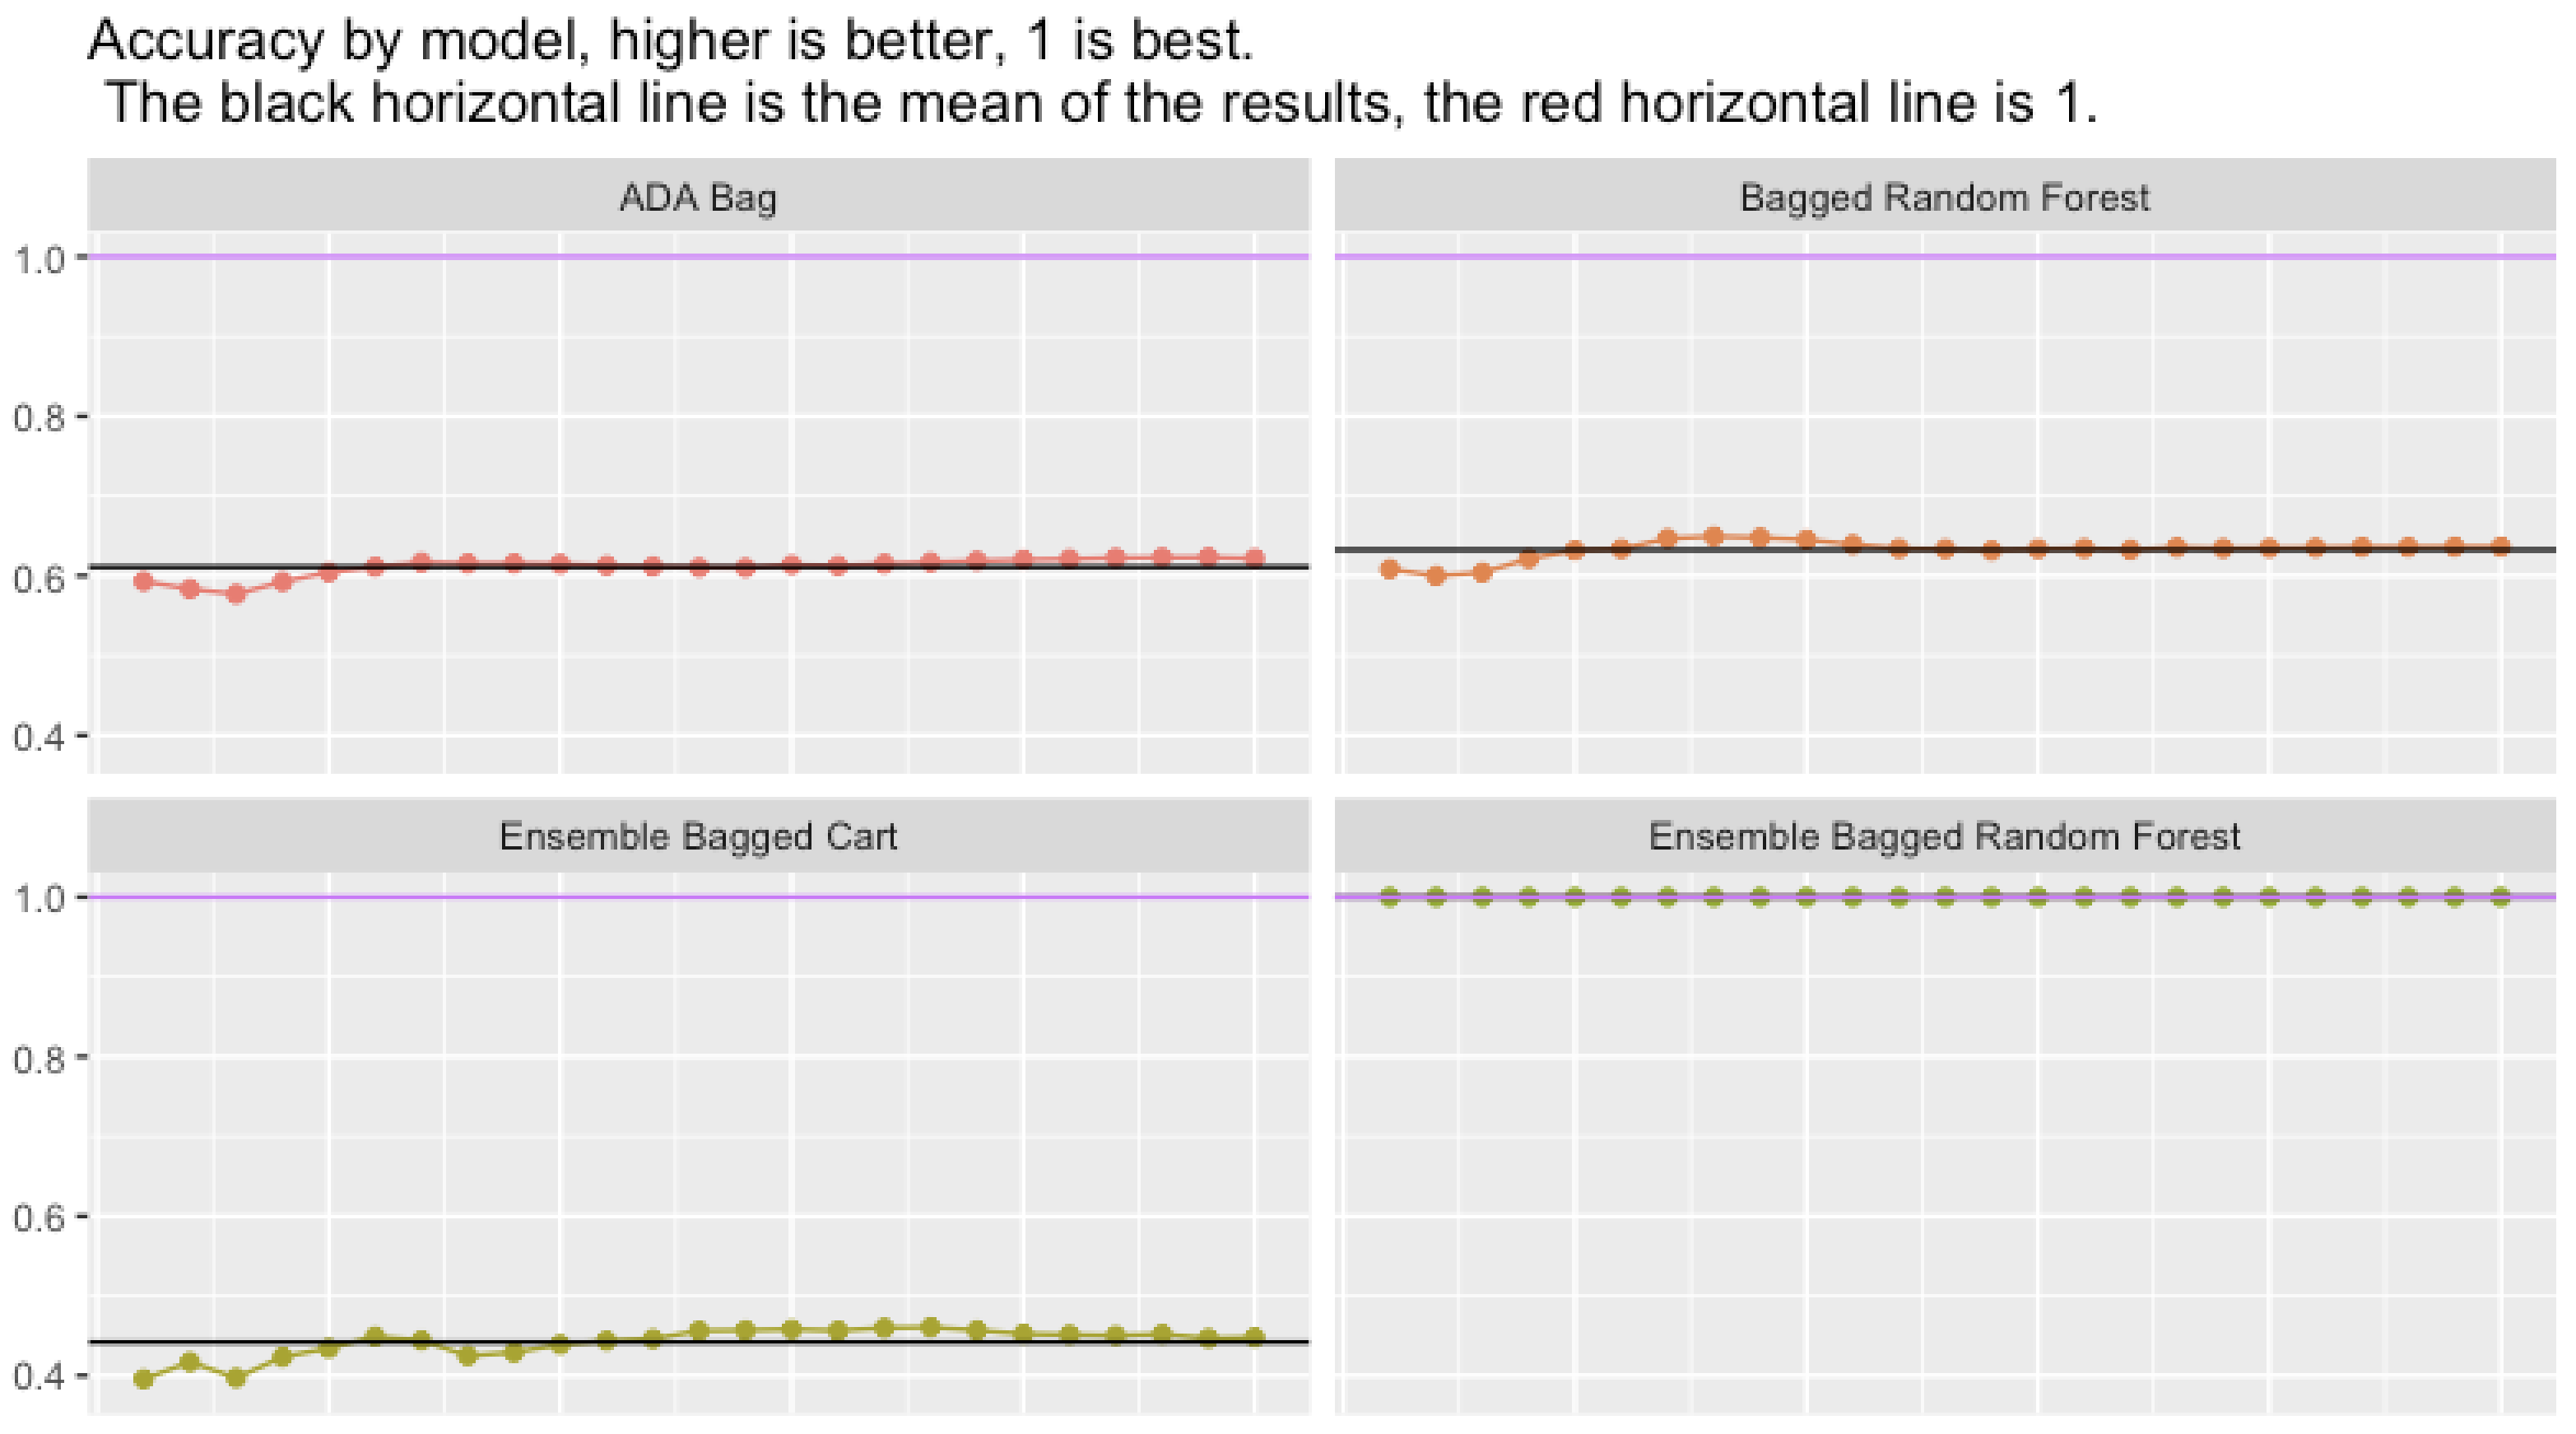
Accuracy by model and resample
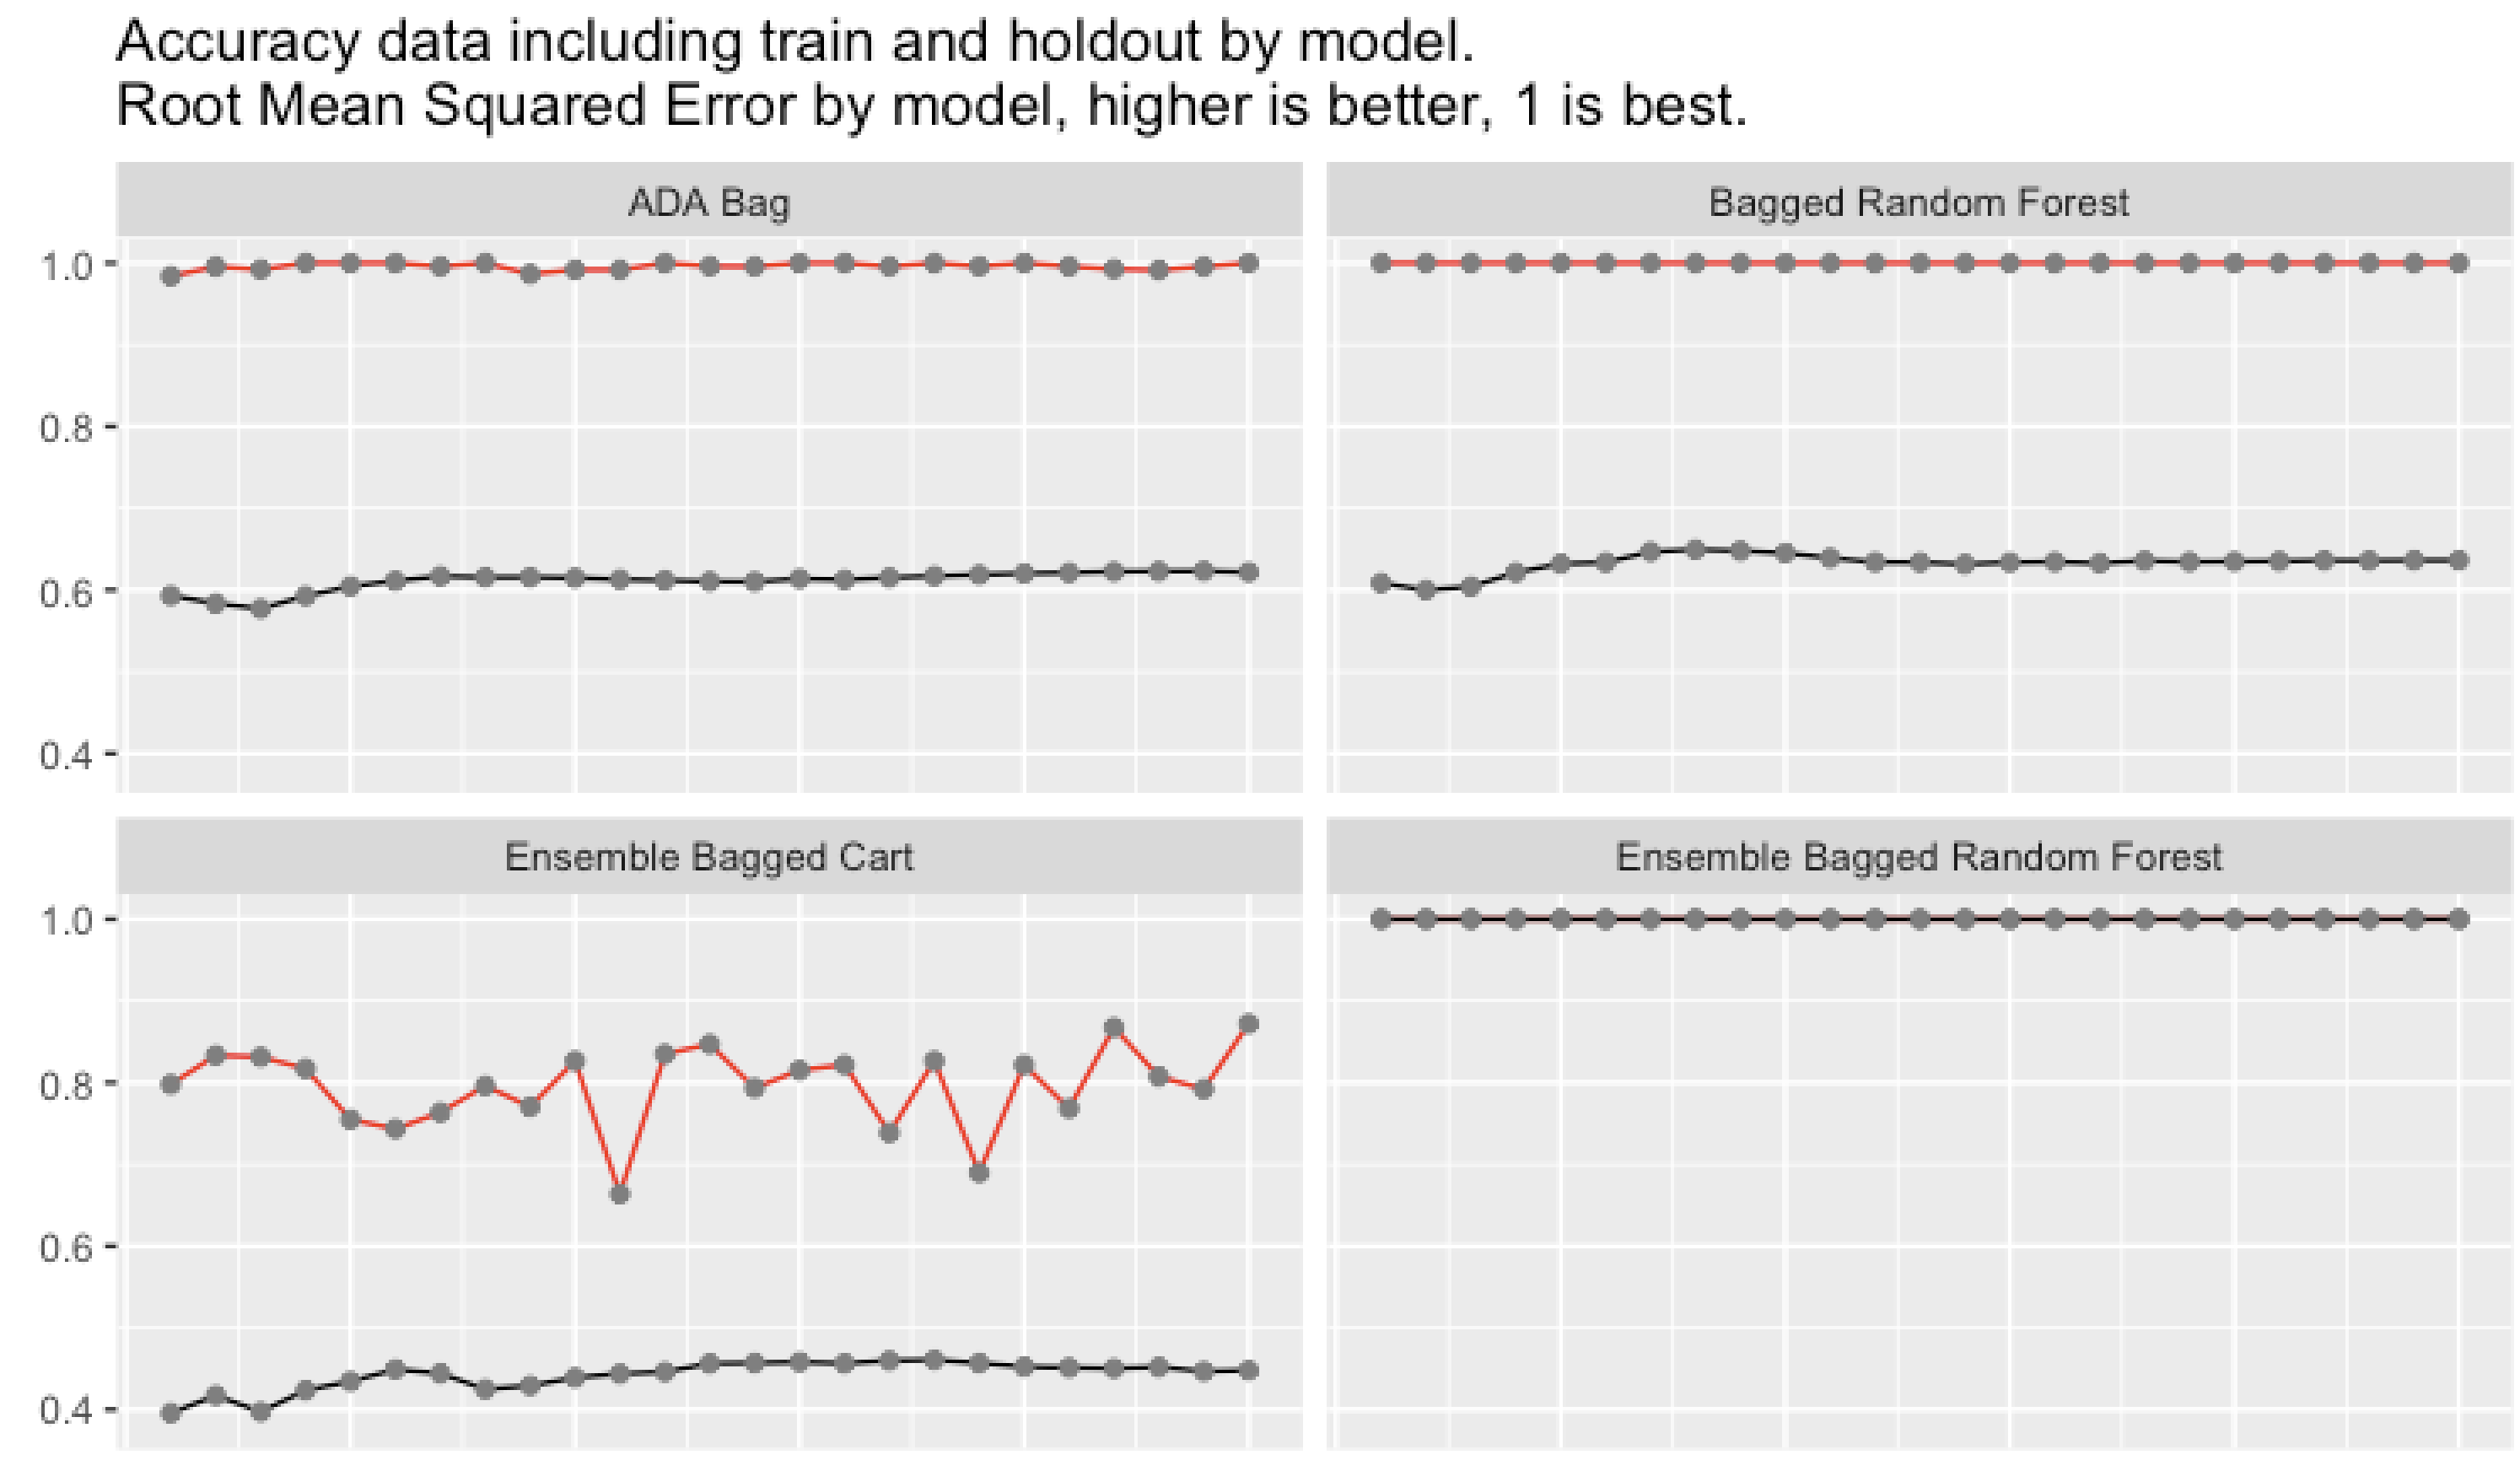
Accuracy including train and holdout
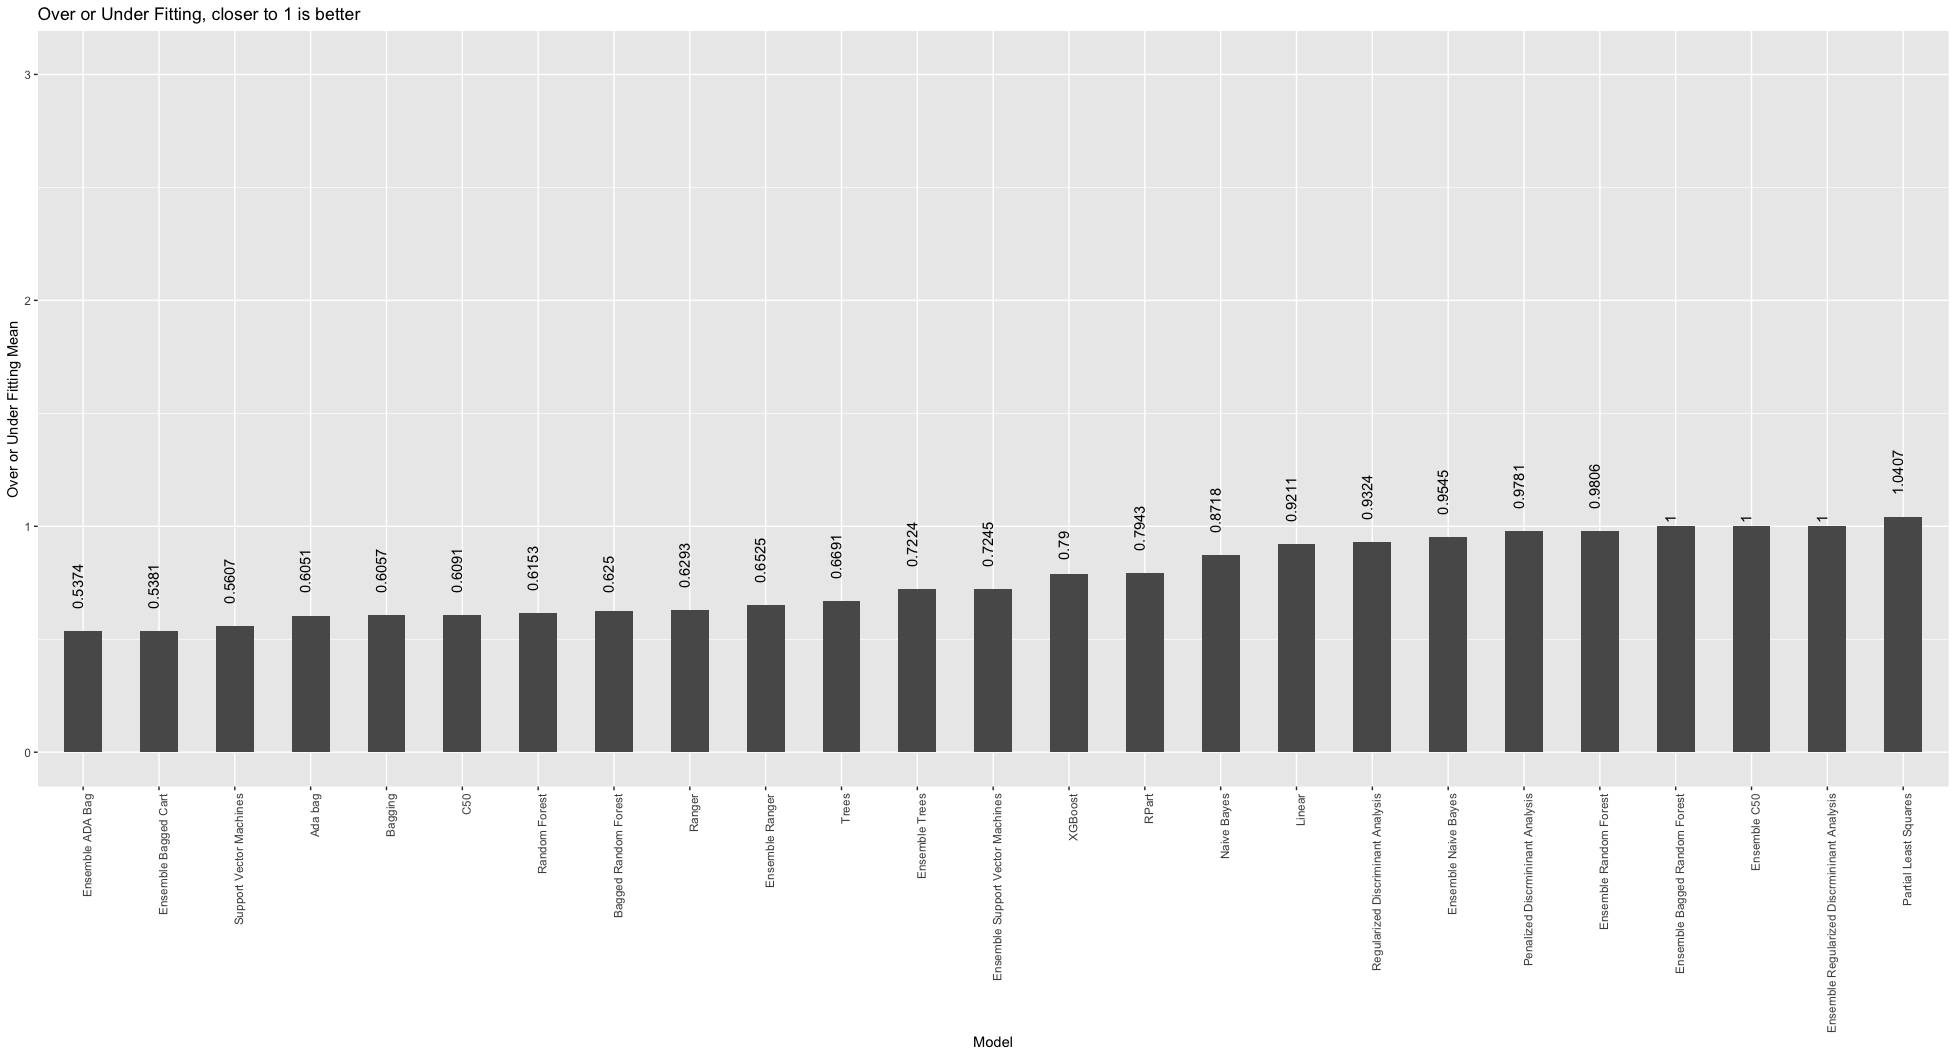
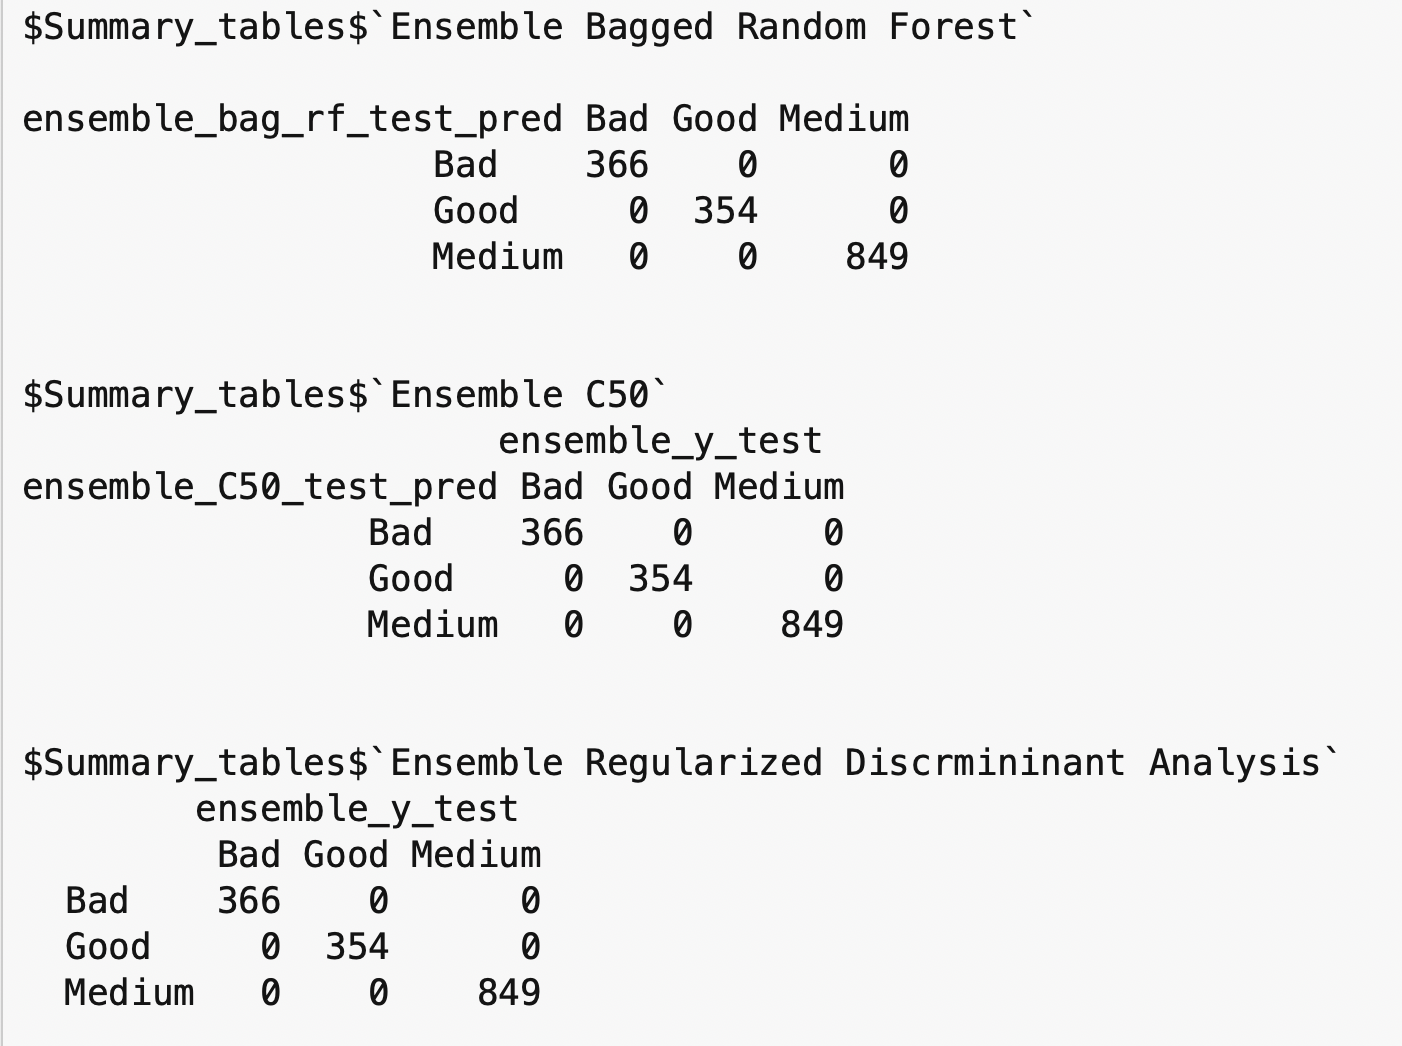
Note that Ensemble Bagged Random Forest had 100% accuracy on the holdout data, 25 times in a row.
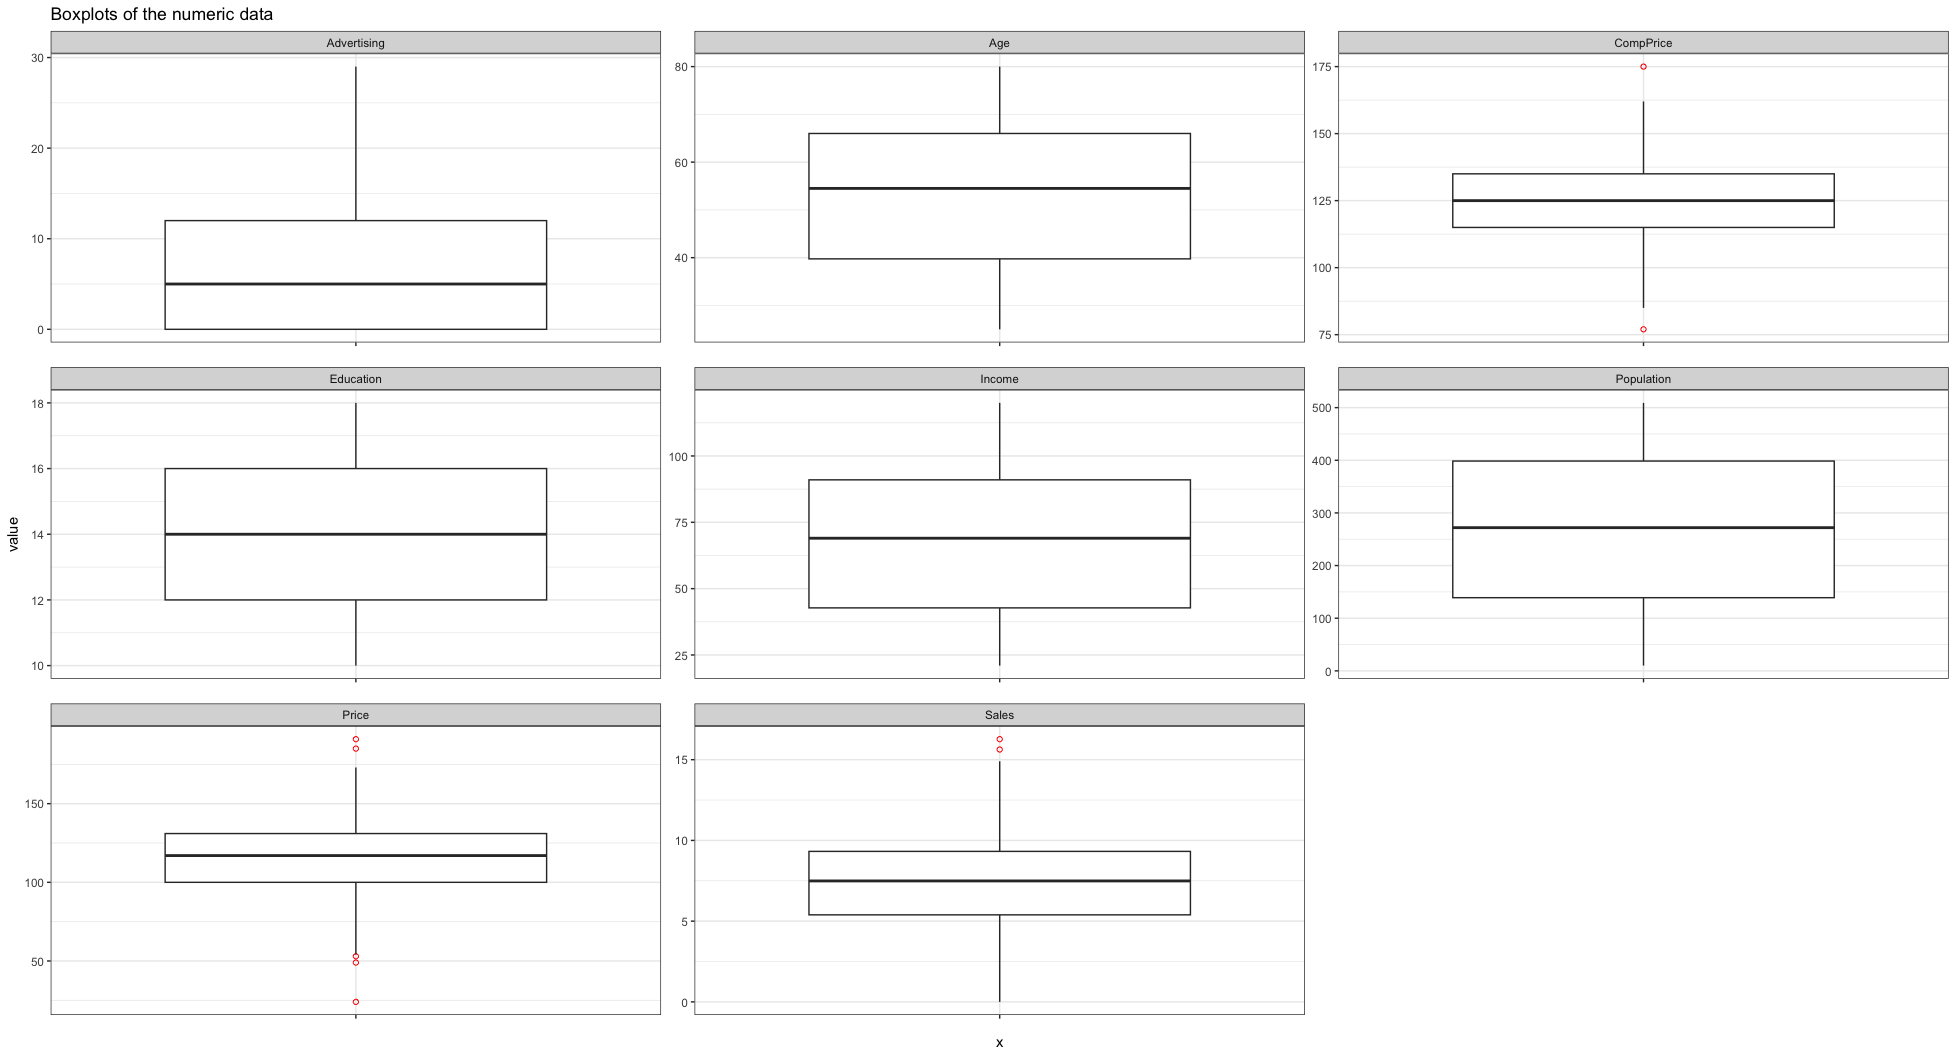
Boxplots of the numeric data
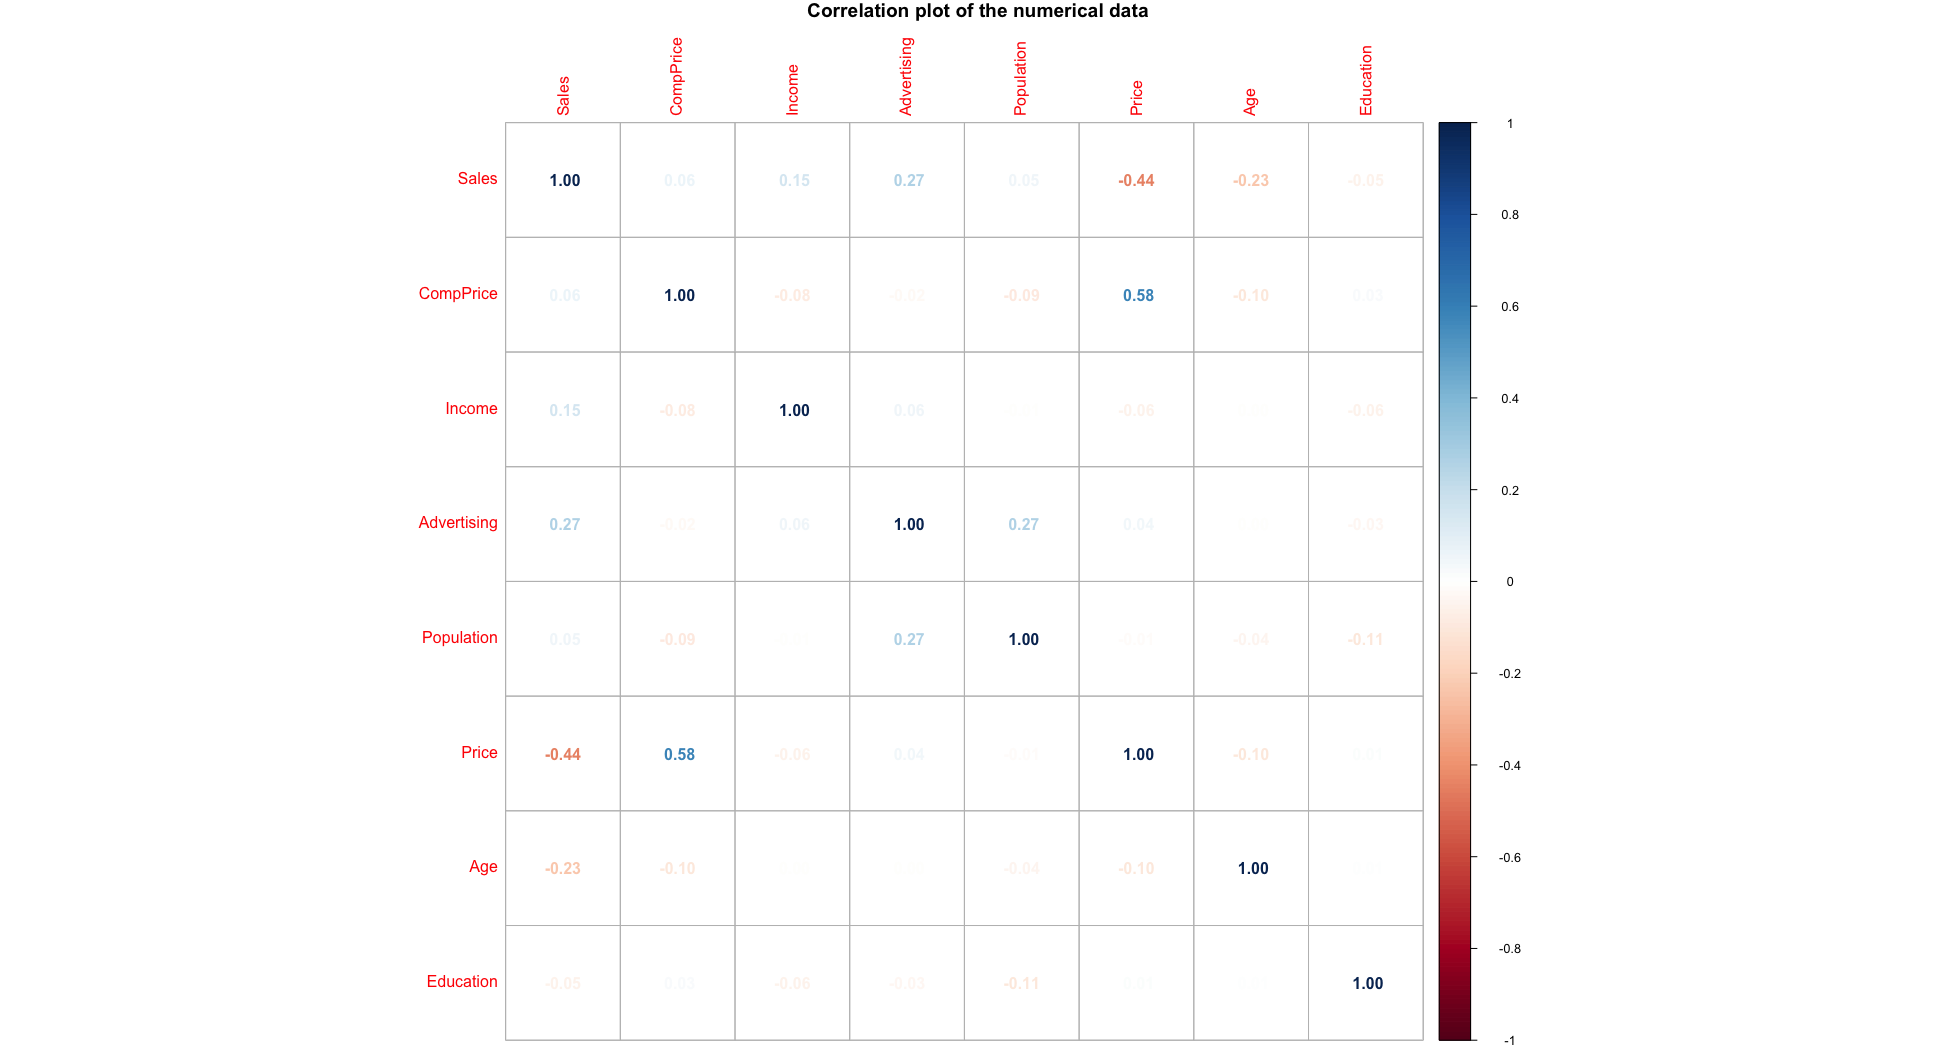
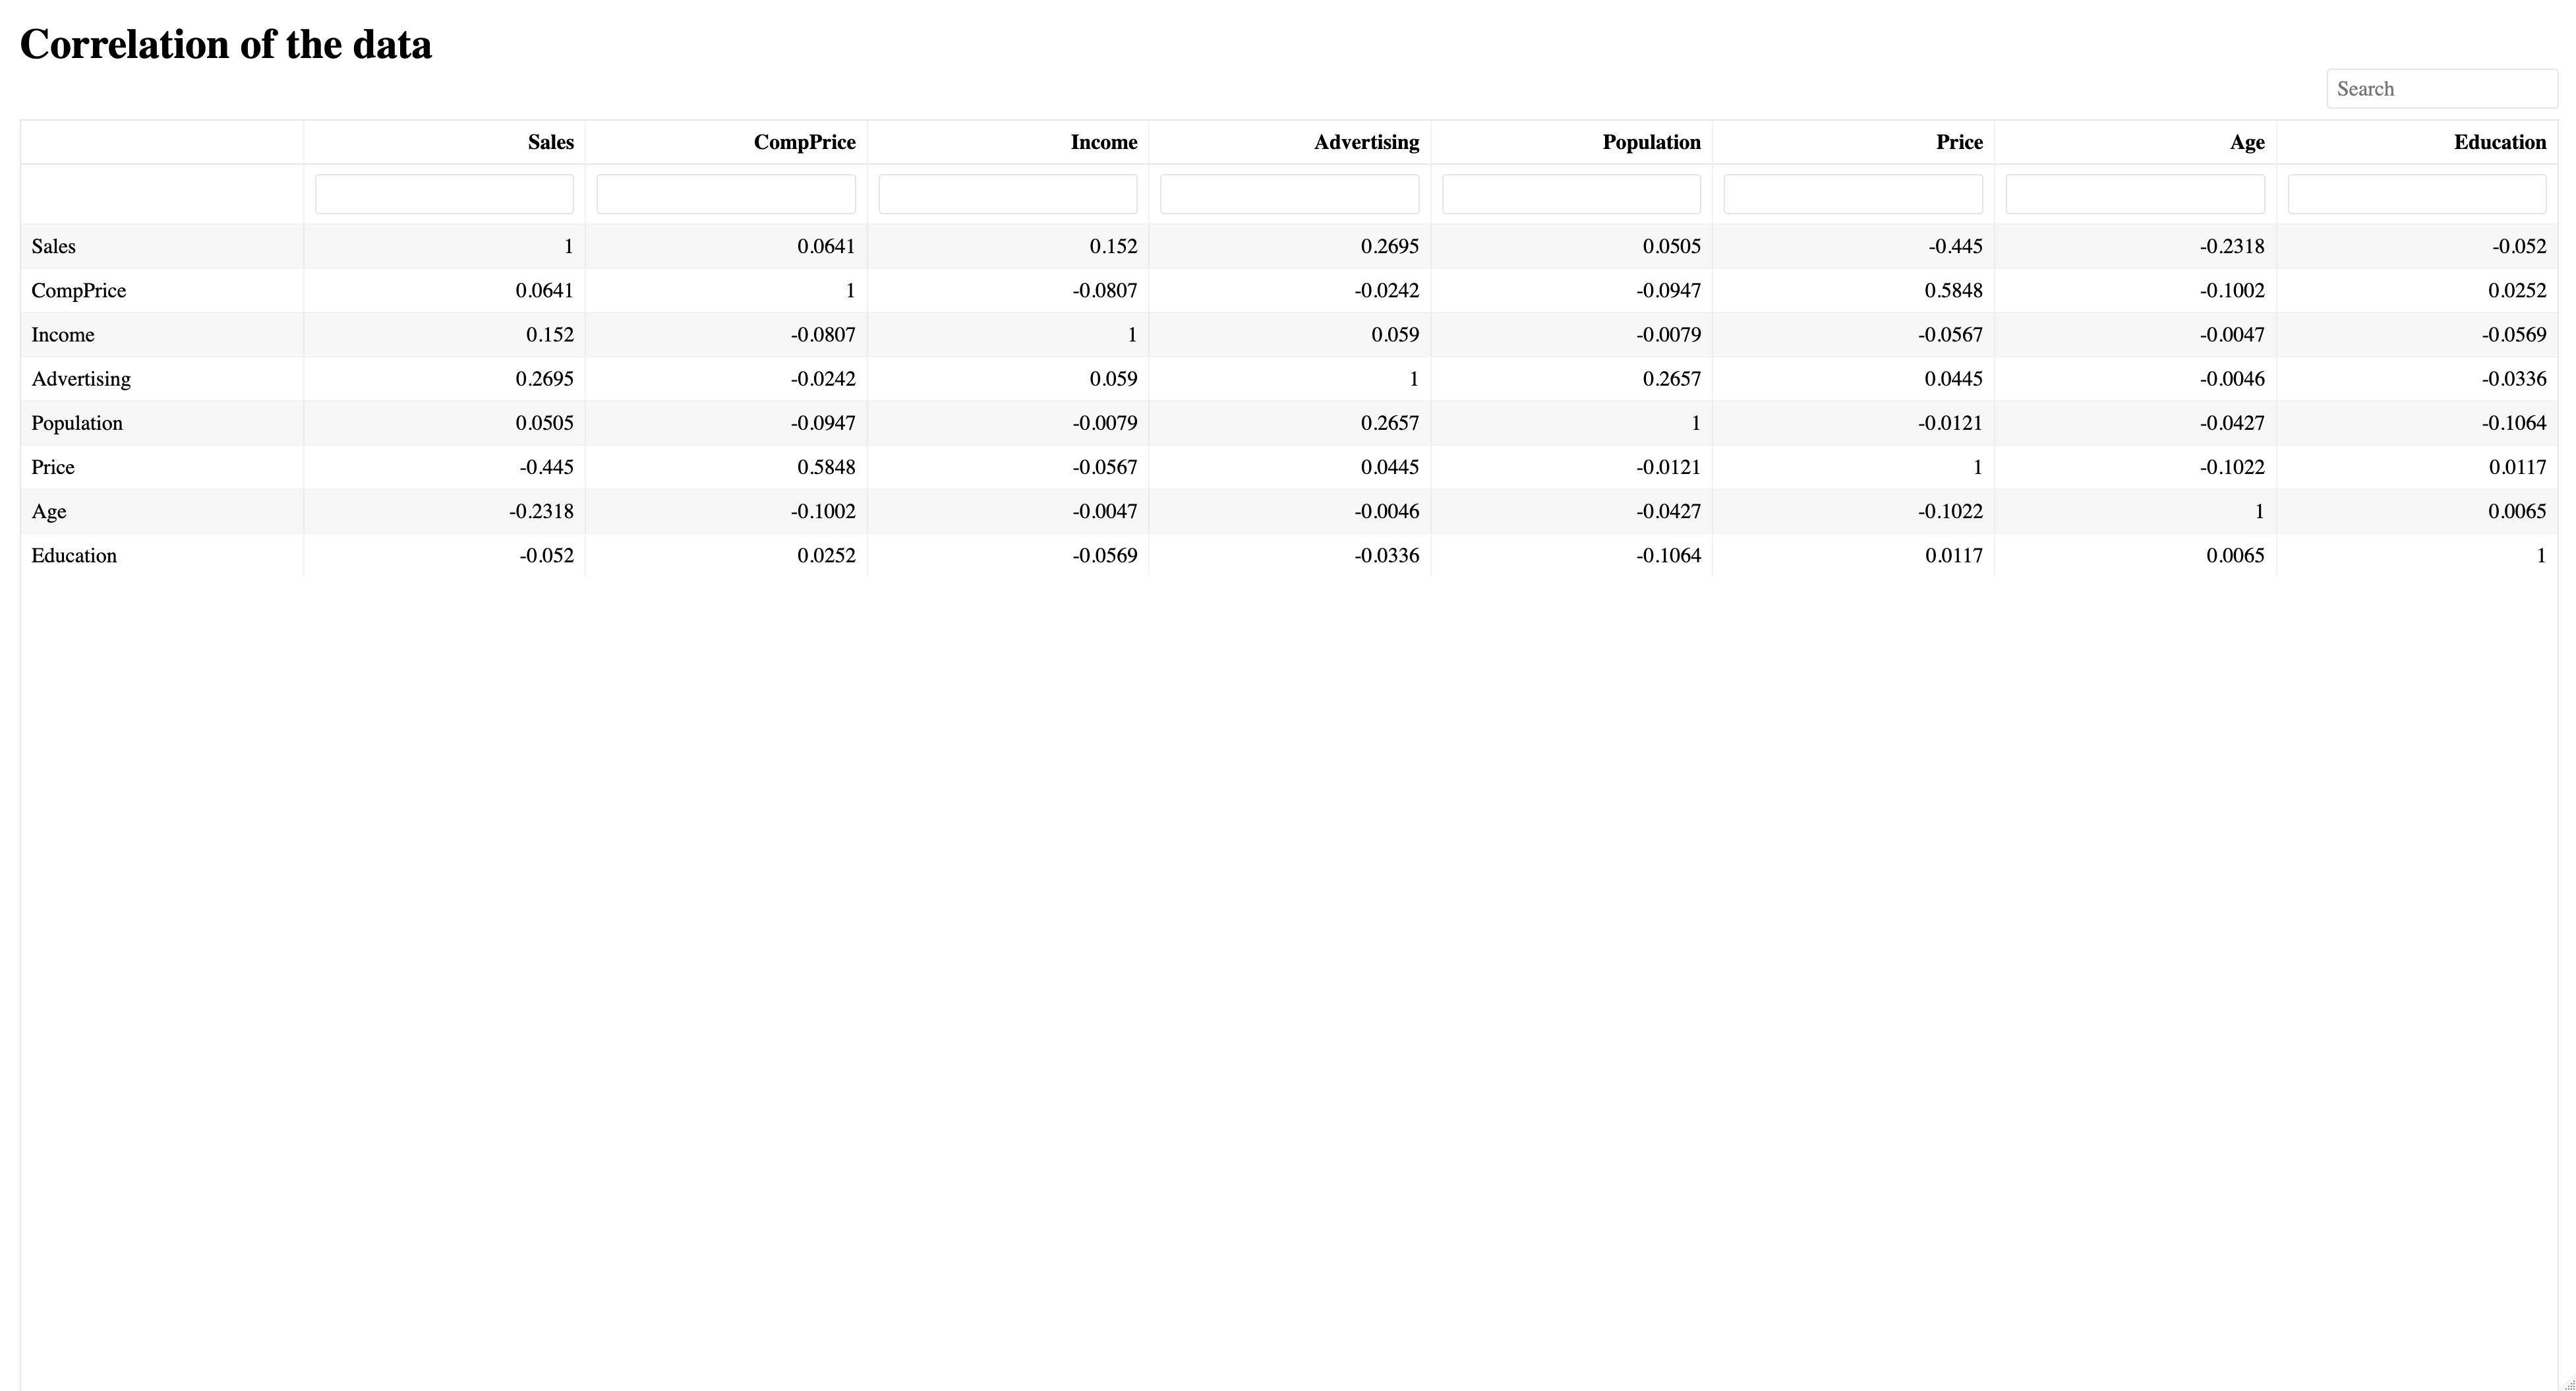
Correlation of the numeric data as numbers and colors
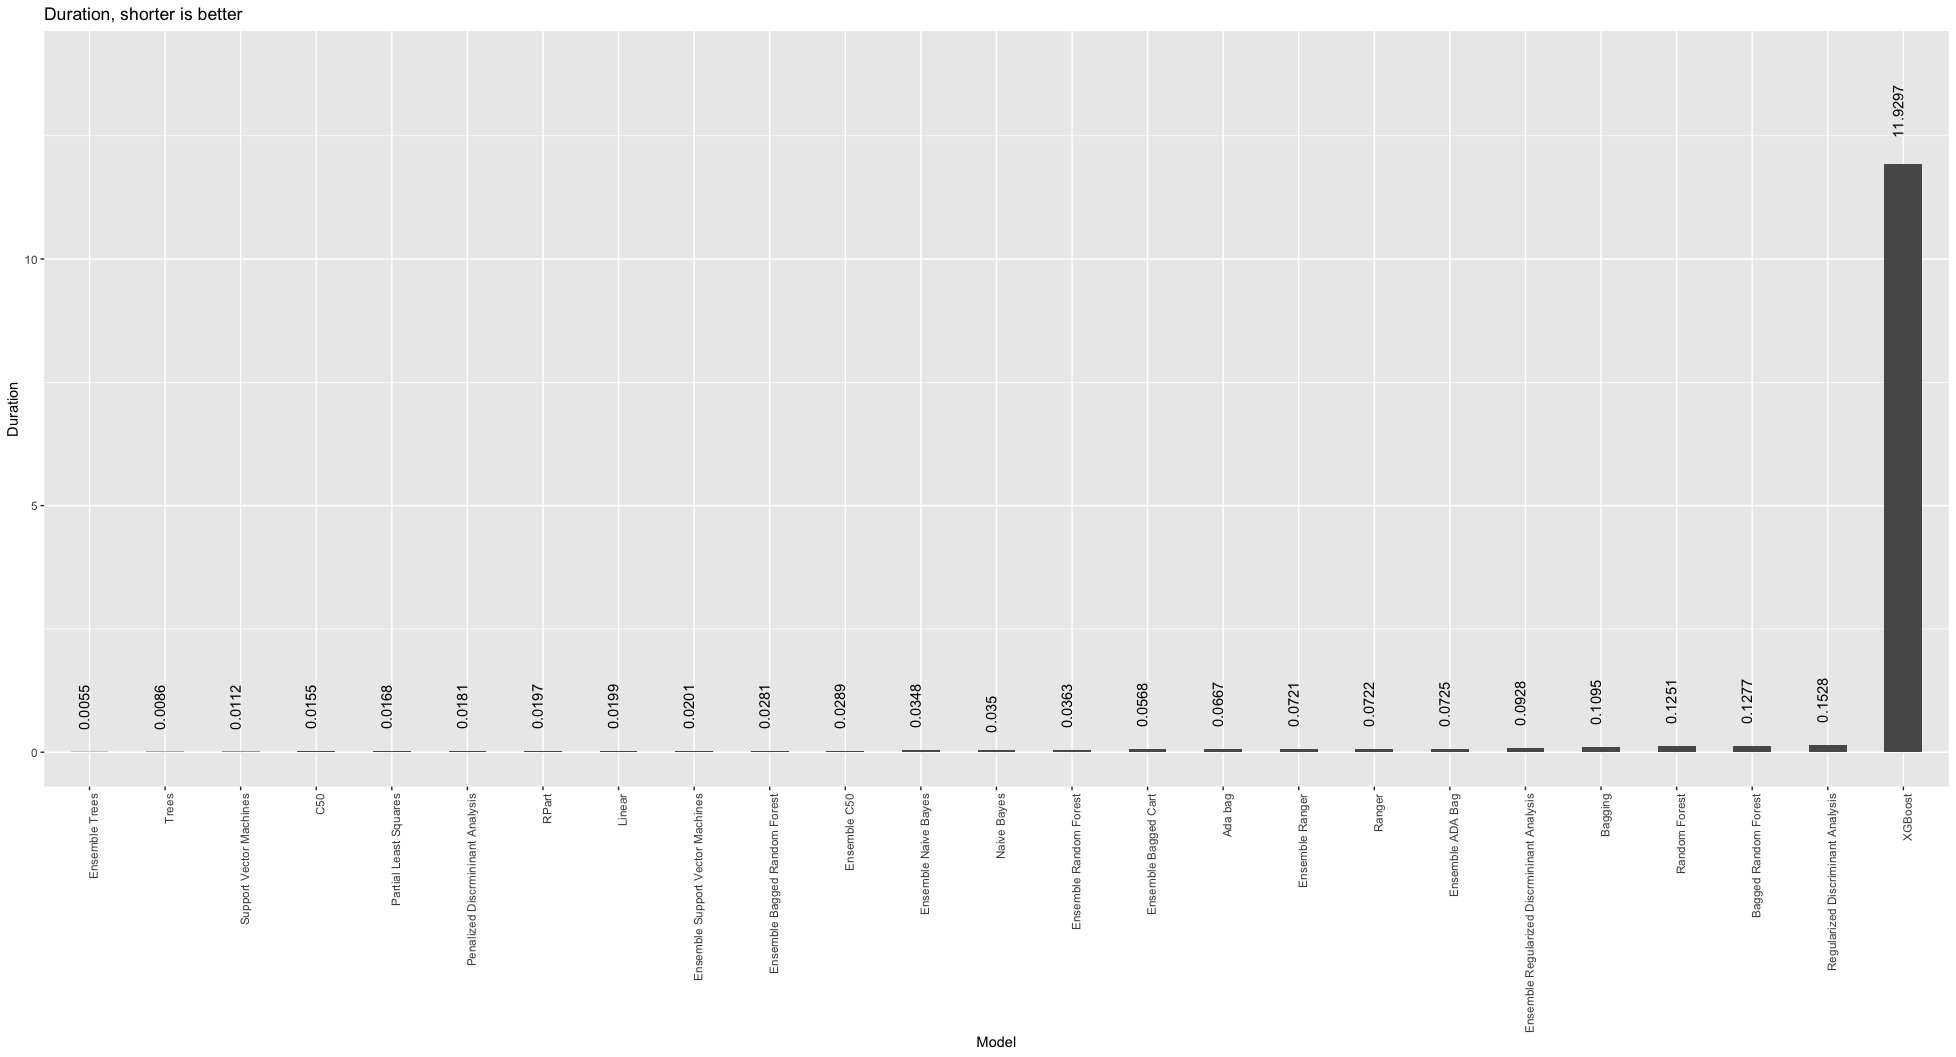
Duration barchart
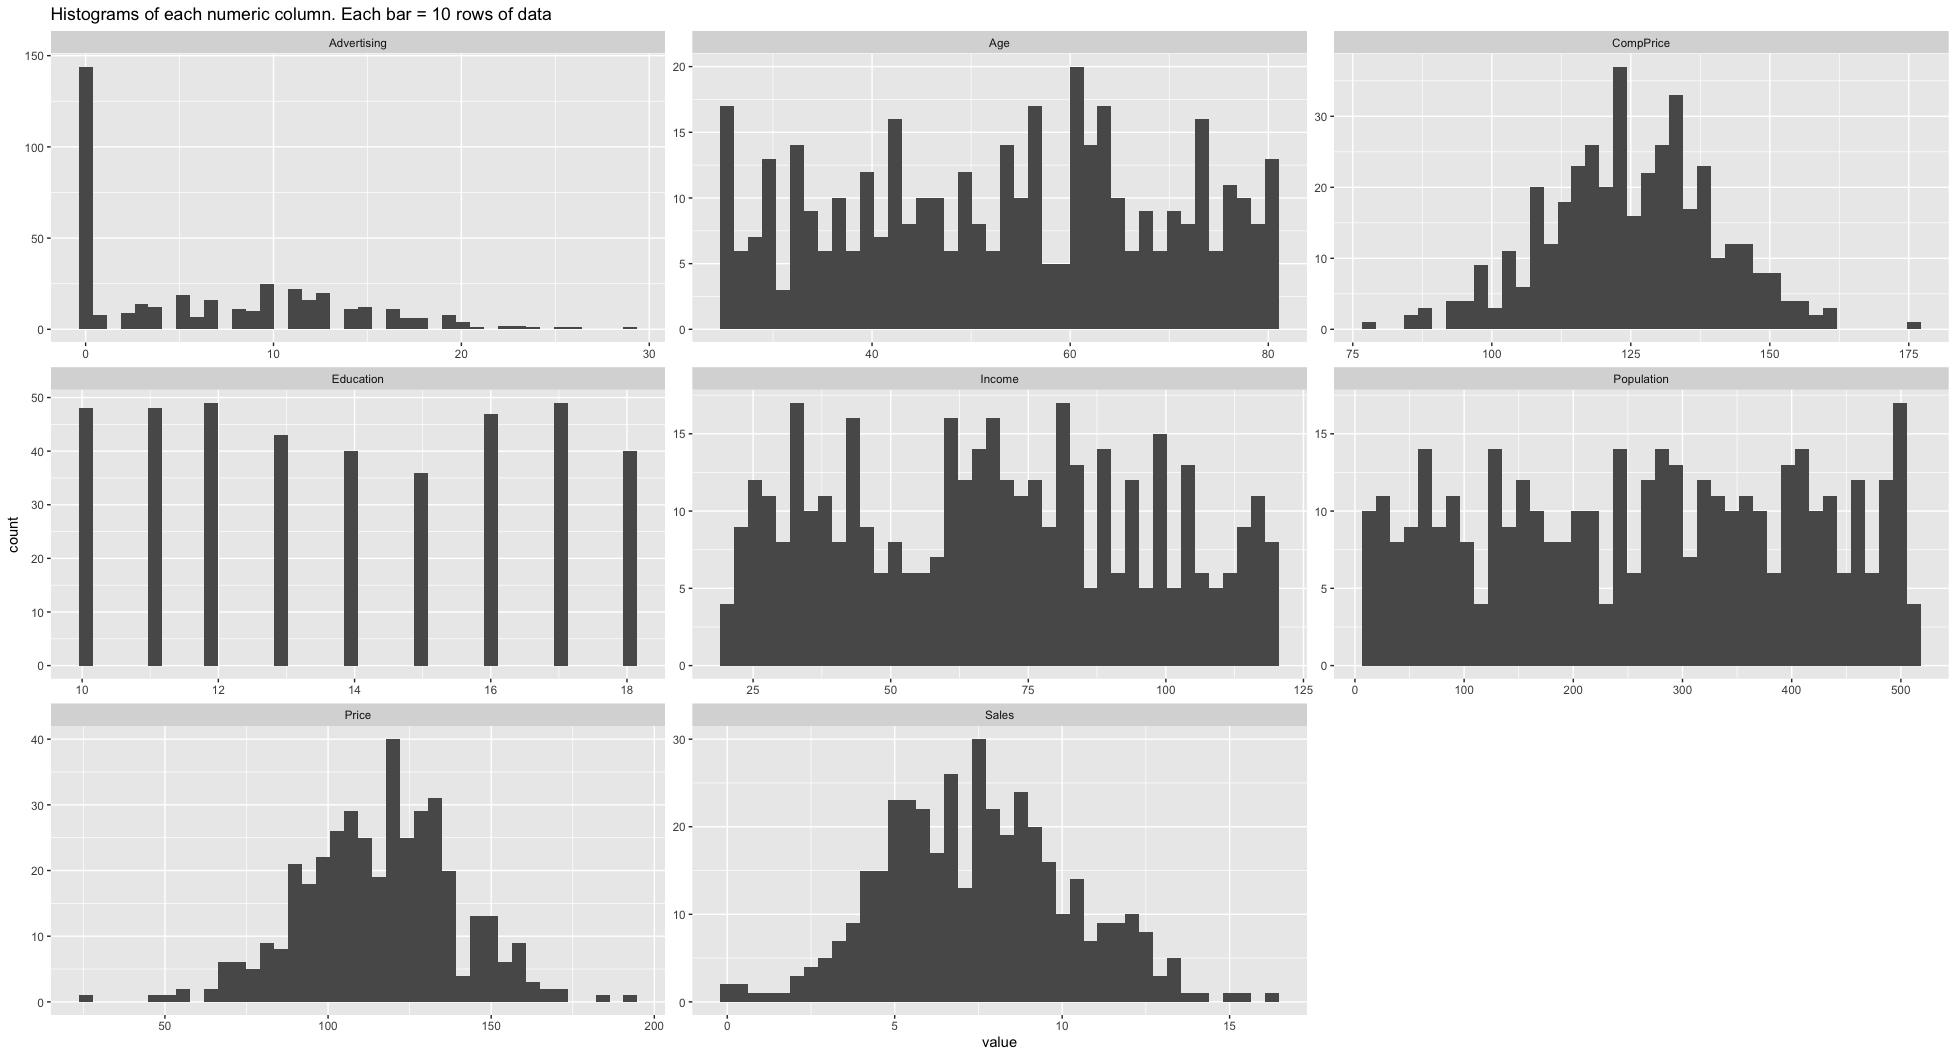
Histograms of the numeric columns
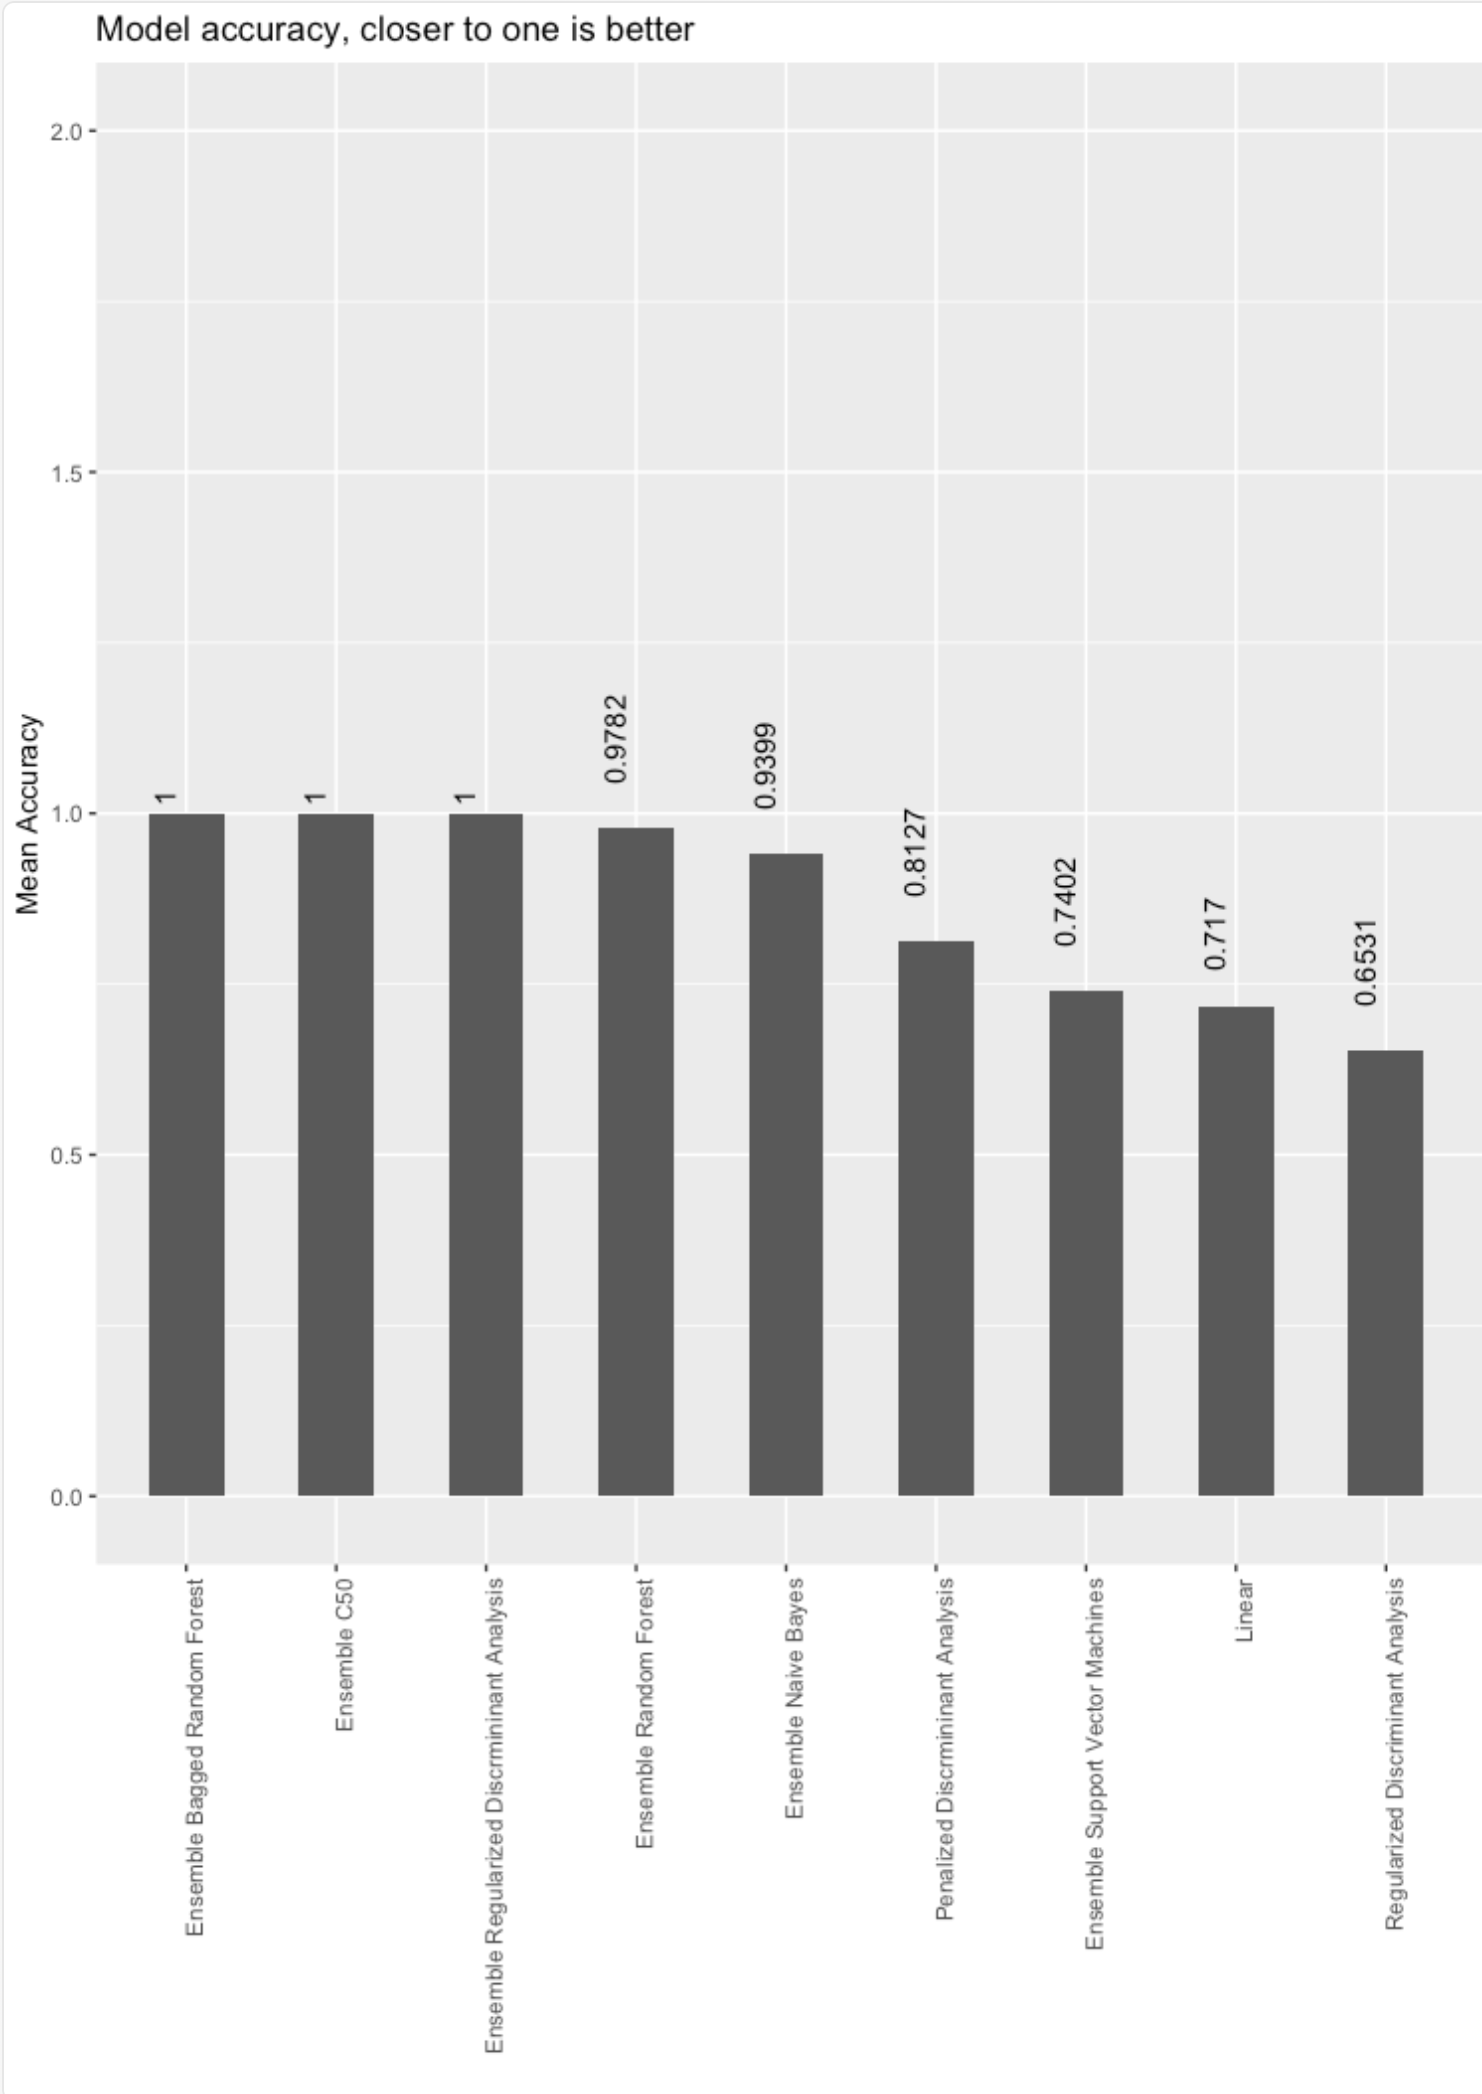
Model accuracy barchart
Over or underfitting barchart
Pairwise scatterplots of the numeric data
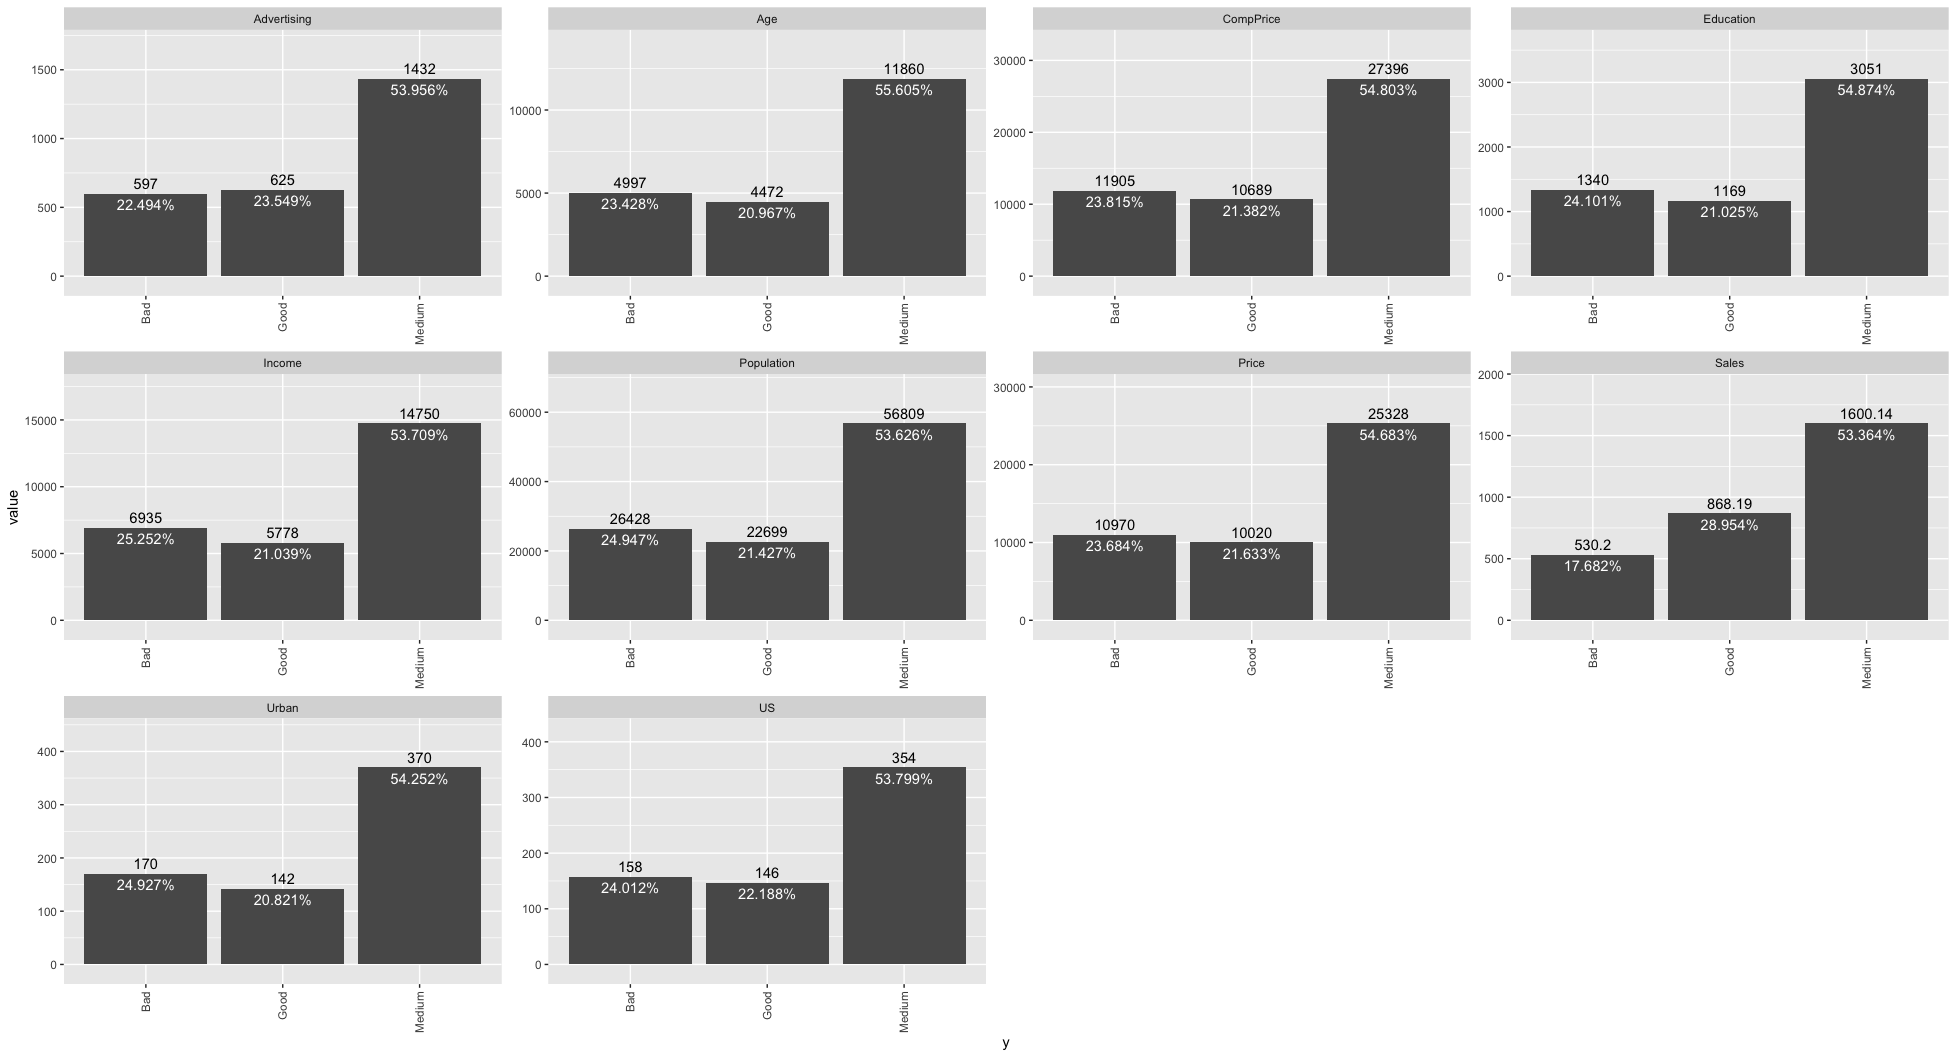
Target vs each feature
Summary report example:
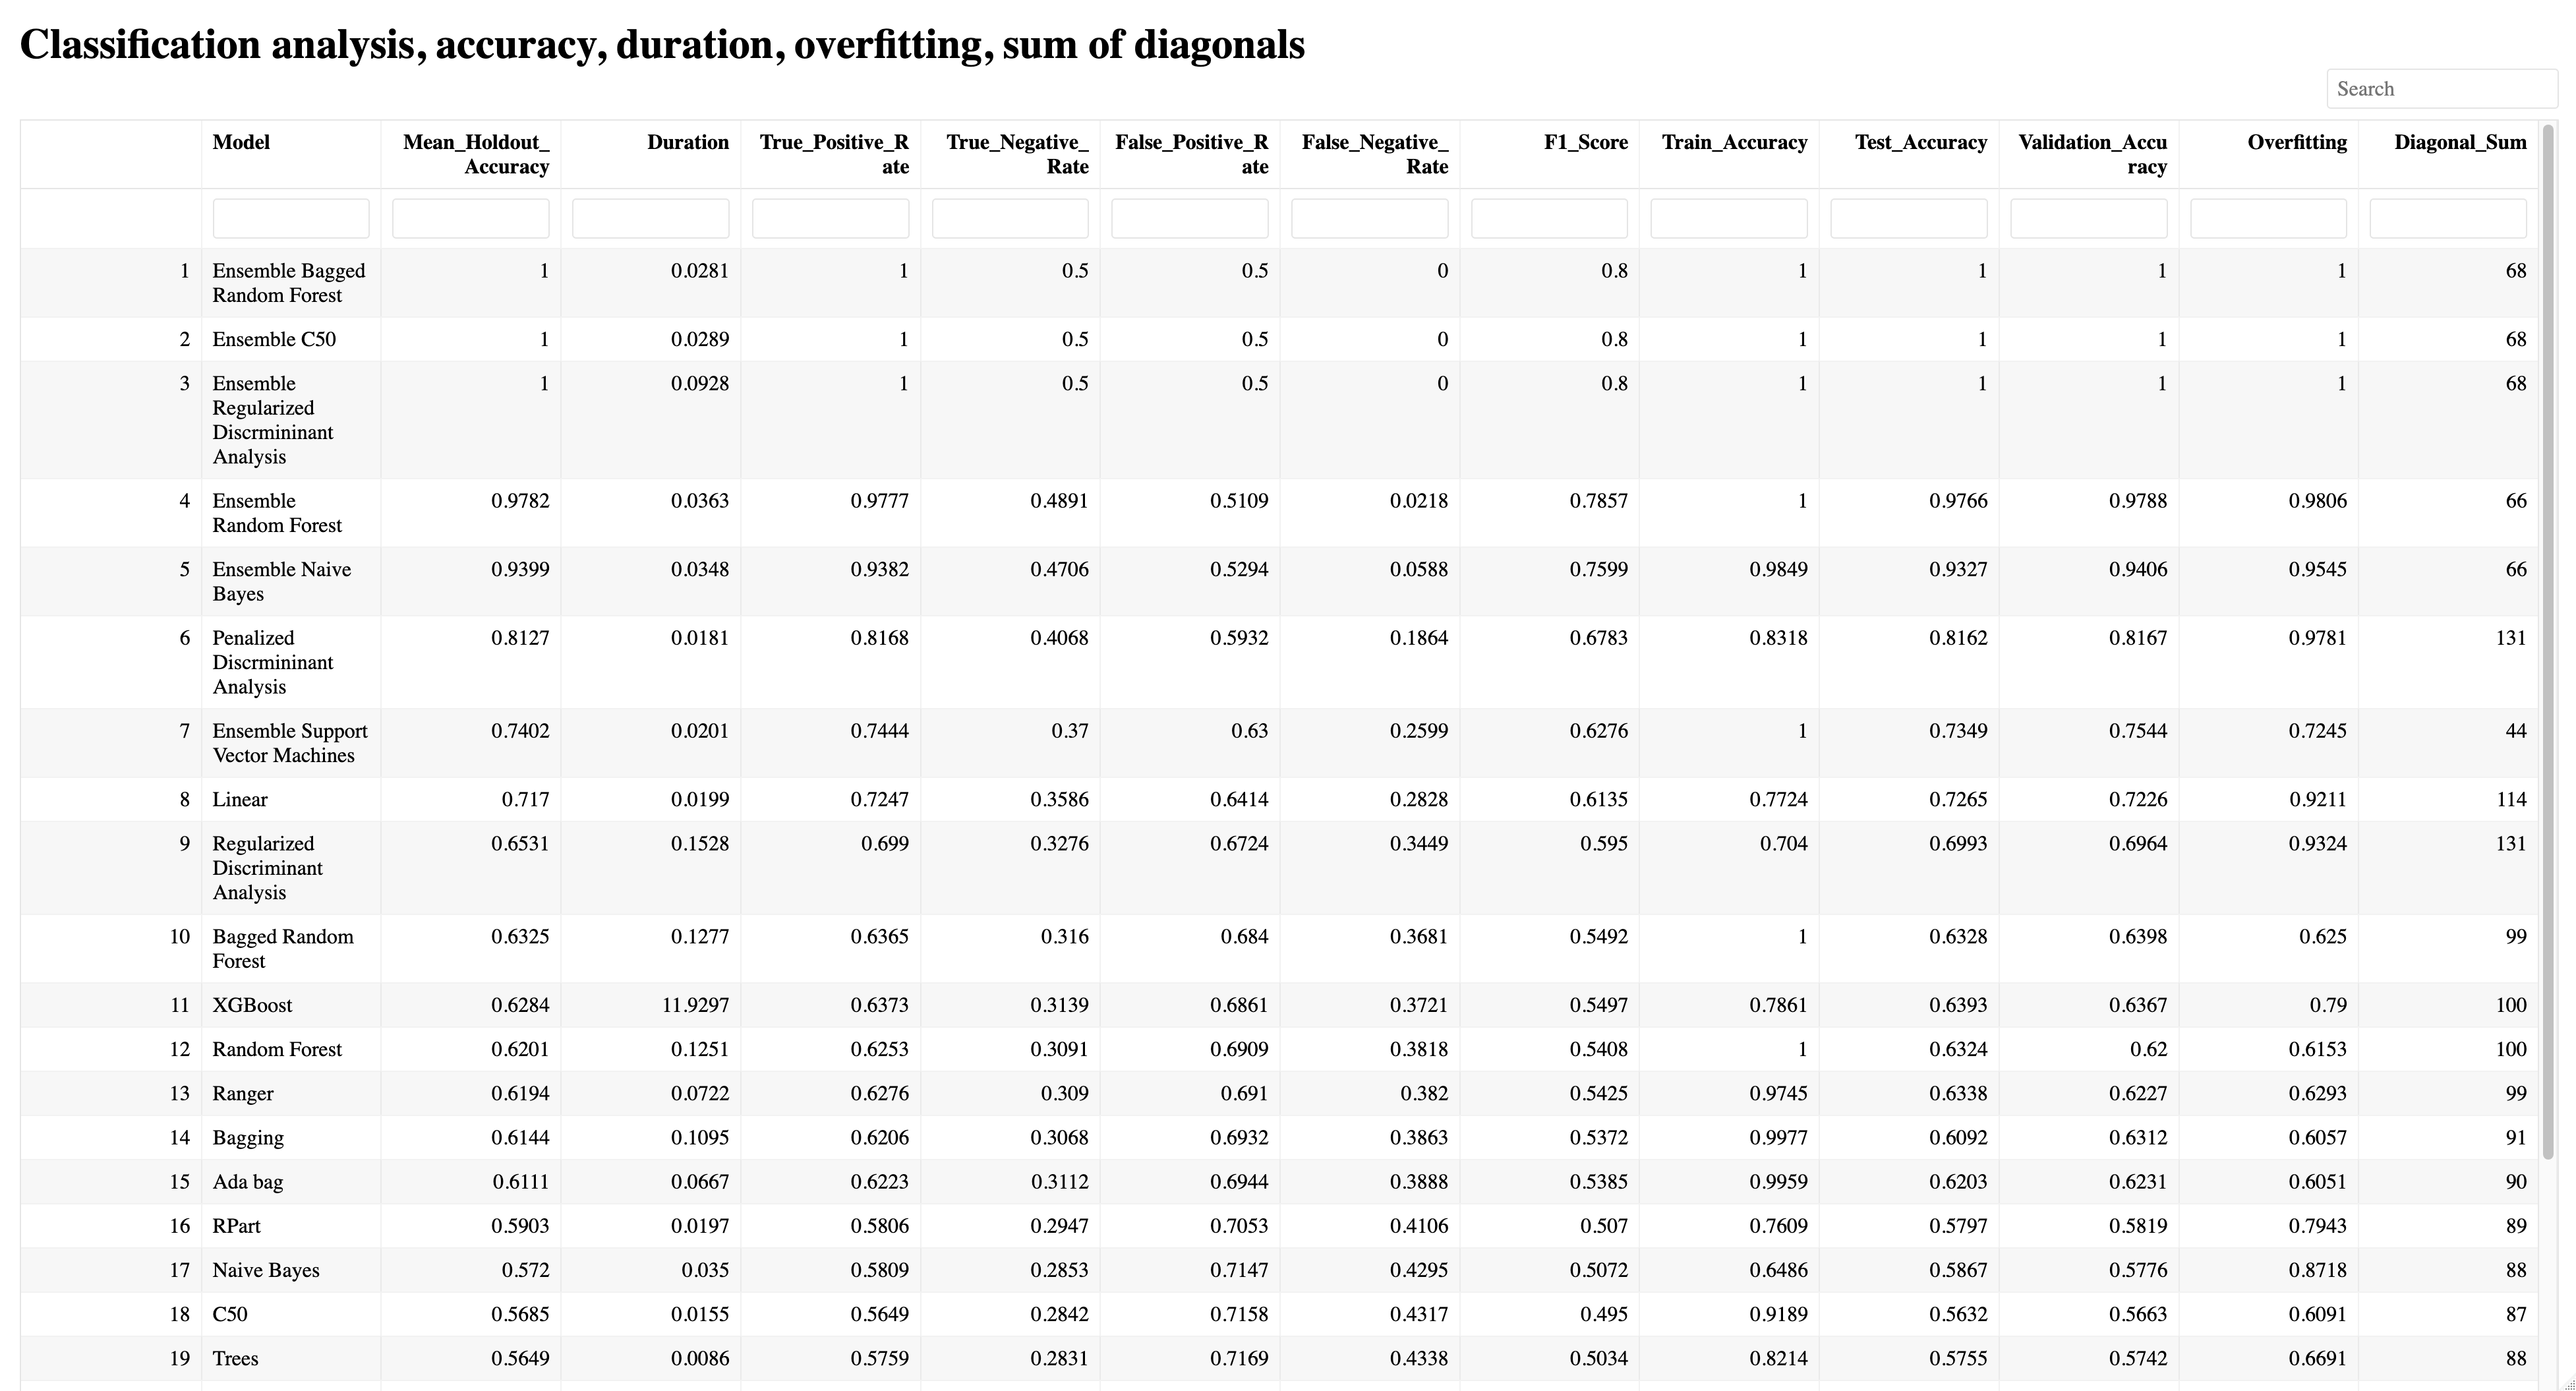
The summary report provides the following for each classification model:
Model name
Holdout accuracy (note the best three models in this example are all ensembles)
Duration
True Positive Rate
True Negative Rate
False Positive Rate
False Negative Rate
F1 Score
Train Accuracy
Test Accuracy
Validation Accuracy
Overfitting
Diagonal Sum
Tables provided:
Summary tables for all models (top three shown in the graphic)
The package also provides summary tables for all models. Here are the summary tables for the models with the highest accuracy:
Grand summary
The ClassificationEnsembles package was able to build 25 classification models from the Carseats data. Three of the ensembles had 100% accuracy 25 times in a row on the holdout data.
The package also automatically provided 11 plots, three tables, a summary report, and summary tables all the models.